
Market Analysis
From Surveys to Continuous Observation: The Next Era of U.S. Crop Intelligence
USDA is rebuilding how it measures American agriculture. The interesting part is not what went wrong last year. It is what the fix reveals about where crop intelligence is heading.
Agricultural markets are built around a small number of highly consequential estimates. When one of those estimates moves by millions of acres, the effect extends far beyond a statistical revision.
On July 15, Agriculture Secretary Brooke Rollins told a roundtable of National Corn Growers Association members that USDA will release a modernization plan for the National Agricultural Statistics Service later this summer. The plan is aimed at transparency, reporting systems and restoring confidence in official data. Deputy Secretary Stephen Vaden said the review will compare USDA projections against actual outcomes for the completed crop year and identify whether any discrepancies point to systemic issues.
This is a significant moment, and it deserves better than a victory lap from the satellite industry. The honest read is not that USDA failed. It is that the entire architecture of agricultural measurement is being asked to do something it was not designed for, and everyone involved now knows it.
What Did USDA Actually Announce?
The modernization plan will examine data collection, acreage reporting, survey methodology and how estimates performed against final results. It follows sustained criticism of the 2025 corn acreage revisions and a documented decline in farmer participation.
USDA has already moved on the participation problem. At an April data users meeting, NASS Administrator Joseph Parsons said the agency wants to increase the sample size for the June acreage survey by roughly 35%, and by 10% for the September, December and March reports, pending approval from the Office of Management and Budget. He said the change should substantially boost usable reports and improve precision for major field crop estimates.
That is a reasonable response to a real constraint. It is also worth being precise about what it does and does not solve.
Why Is Survey Participation the Real Story?
Rollins put the numbers plainly. Response rates for reports like Crop Production, Acreage and Grain Stocks ran between 80% and 85% in 1992. They fell to roughly 50% to 55% by 2016. They now average around 30%.
The March 2026 Prospective Plantings survey drew a 37.6% response rate, down from 44.3% the year before and the lowest ever recorded for that report.
There is a feedback loop here that deserves naming. Lance Honig, chair of the Agricultural Statistics Board, has publicly described a trust gap with producers, and has warned that frustration over revisions could itself discourage participation in the surveys that would make future estimates better. Declining confidence reduces response rates. Lower response rates widen uncertainty. Wider uncertainty produces larger revisions. Larger revisions erode confidence further.
Expanding the sample sends more requests into that loop. It does not, on its own, reverse the direction of travel.
Can a Periodic Survey Track a Crop That Changes Daily?
Here is the part of the 2025 story that got lost in the noise, and it is more interesting than the headline.
USDA's two survey-based acreage estimates for 2025 corn were remarkably stable. The March Prospective Plantings survey came in at 95.3 million acres. The June Acreage report, the first survey of actual plantings rather than intentions, came in at 95.2 million. A move of 100,000 acres.
Then the August Crop Production report raised the figure to 97.3 million, drawing heavily on Farm Service Agency administrative records. The January annual summary finalized it at 98.79 million, the largest U.S. corn footprint since 1936.
Read that sequence carefully. The survey system was not internally inconsistent. It was coherent, stable and wrong. The correction arrived only once administrative paperwork caught up, months after the crop was in the ground and, by January, already harvested.
This is not a failure of statistical craft. It is a structural property of any system that samples opinion at a point in time and then waits. Farmers change planting decisions late. Weather delays or prevents planting. Fields get replanted. Crop type becomes visually unambiguous only as plants develop. Drought, hail and flooding reshape harvested acreage after every survey has closed.
A survey captures what respondents knew or intended on the day they answered. A satellite-based system observes what is physically developing across the landscape, repeatedly, whether or not anyone fills out a form.
Both have limitations. Optical imagery contends with cloud cover, classification uncertainty and the genuine difficulty of distinguishing crop type early in the season. Neither approach is complete on its own. That is the point.
Isn't USDA Already Using Satellites?
Yes, and any argument that ignores this is not worth making.
NASS produces the Cropland Data Layer using satellite imagery, Farm Service Agency data and additional land-cover inputs. The 2025 CDL was released in February 2026, built on Landsat and Sentinel-2 imagery with a random forest classifier running in Google Earth Engine. Spatial resolution moved from 30 meters to 10 meters beginning with the 2024 product.
USDA is also explicit that its acreage estimates are not pixel counting. They are statistical estimates that combine remote sensing with survey and administrative data.
So the question was never surveys versus satellites. USDA settled that debate internally years ago. The open question is how many independent lines of evidence the market gets to see, how often, and how early. We have written about why the world needs an independent global crop classification layer rather than a single official one, and the 2025 acreage sequence is the clearest argument for it yet.
What Does a Hybrid Crop Intelligence System Look Like?
Four layers, each doing what it does best.
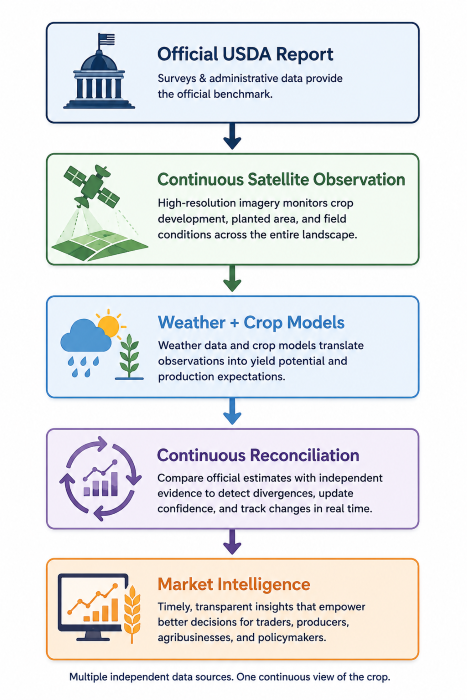
Layer 1: Official surveys and administrative records. Standardized definitions, historical continuity, producer-reported ground truth and the benchmark everyone prices against. This layer is not going away and should not.
Layer 2: Independent physical observation. Repeated evidence of what is planted and where crops are developing, updated on the cadence of the satellite rather than the cadence of the report calendar.
Layer 3: Weather and crop-development models. Interpretation of what observed conditions imply for yield and production. As we have argued before, weather alone is not enough without the biology that translates conditions into outcomes.
Layer 4: Continuous reconciliation. The layer almost nobody builds. This is where official expectations, observed physical conditions and model output get compared throughout the season, so divergence surfaces as it emerges rather than as a January surprise.
This is the same human plus machine architecture we think the whole category is converging toward. No single layer is authoritative. The value is in the reconciliation.
Why Isn't Accuracy Enough?
A system can arrive at the correct number and still be commercially useless if it arrives late.
For institutional users, the final figure is only part of the value. What matters equally is what could have been observed on each date, when the physical signal first diverged from the prevailing estimate, and how confidence changed as evidence accumulated. That requires point-in-time integrity: preserved historical versions, honest confidence intervals, and clear documentation of every revision.
This is why we have argued that accuracy alone does not change trader decisions, and that in agriculture, alpha is not information but time. A signal that told you in August what USDA would confirm in January is worth something. A signal that agrees with USDA in January is worth nothing.
What Should Modernization Prioritize?
Five things would make the official layer more useful to everyone building on top of it.
Publish clearer uncertainty measures. Confidence ranges, response rates and the specific factors driving uncertainty, surfaced alongside the headline number rather than buried in methodology documents.
Increase methodological transparency. Explain how surveys, administrative data, remote sensing and analyst judgment are weighted and combined.
Measure forecast performance systematically. Vaden's commitment to compare projections against actuals is the single most valuable item in the announcement. It should be recurring, public and granular.
Expand machine-readable, point-in-time access. Preserve historical vintages so users can evaluate what was genuinely knowable on each date.
Create pathways for independent validation. Let universities, technology providers and market participants compare independent physical signals against official estimates in the open.
NASS already publishes methodology and quality reports covering questionnaires, response rates and coefficients of variation. The foundation exists. Modernization is a chance to make it legible to the people trading on it.
Why This Is an Opportunity, Not a Crisis
USDA's review is not evidence that official statistics have stopped mattering. It is evidence of the opposite. These estimates are consequential enough that the systems producing them have to keep evolving, and the department is saying so publicly rather than defending the status quo.
The opportunity is to combine the institutional credibility of official statistics with the speed, scale and repeatability of modern Earth observation. Markets do not need fewer trusted sources. They need more transparent evidence and better ways to reconcile it. We have written about what happens when the official data stops, and the answer is never that markets stop needing to know.
Independent does not mean adversarial. It means separately observed, reproducible and available for comparison.
At SatYield, we think the future of crop intelligence is a continuously updated physical supply layer that complements official reporting and helps users see where the crop is tracking toward, or away from, prevailing expectations. The 2025 corn season made the case better than any pitch deck could.
Agriculture has always depended on observation. The difference is that today, we can observe nearly every field on Earth, repeatedly, objectively and at scale.
USDA's modernization is not the end of survey-based agriculture. It is the beginning of a more resilient crop intelligence ecosystem, where official statistics, satellite observations and predictive models reinforce one another rather than compete.
Markets will always need trusted benchmarks. Increasingly, they will also need continuous evidence.
more from the blog