Market Analysis
When the Official Data Stops: How to Navigate Agricultural Markets in Reporting Gaps
Reporting gaps in agriculture are no longer rare events. They’re becoming structural. Climate extremes, geopolitical instability, survey disruptions, and shrinking government budgets routinely interrupt the data streams analysts and traders once relied on. Yet markets continue moving even when the information flow slows to a trickle.
In this environment, navigating agricultural markets during reporting outages is no longer optional. It is a core capability for alt-data teams, risk managers, traders, and procurement leads who cannot afford to wait for official numbers to return.
Why are agricultural reporting gaps increasing?
A convergence of climate, geopolitical, and institutional factors is driving more frequent data interruptions.
Climate shocks, including droughts, floods, and wildfires, are making in-season field assessments difficult or impossible. The Intergovernmental Panel on Climate Change (IPCC), which is the United Nations body for assessing the science related to climate change, has documented a sharp rise in these disruptions, many of which directly diminish the reliability of crop monitoring networks.
Conflict zones add deeper opacity. In parts of the Black Sea, Sudan, and the Middle East, field verification is dangerous or impossible, and even satellite observations become difficult to validate without ground truth.
Institutional and budget constraints complete the picture: statistical agencies now operate with fewer resources, thinner survey samples, and increased political pressure, all of which can distort or delay official crop estimates.
The monitoring system was built for the stability of the past, not the volatility of the present.
What do past reporting disruptions show us about market risk?
Historical episodes make one thing clear: when visibility collapses, uncertainty, not fundamentals, drives price formation.
During U.S. government shutdowns, National Agricultural Statistics Service (NASS) reports have halted entirely, forcing markets to trade on rumor and fragmented private intelligence. In conflict periods around the Black Sea, sunflower and wheat markets suffered months-long blind spots. And during severe drought years in Brazil and the U.S. Plains, field-survey networks deteriorated mid-season, leading to contradictory or incomplete assessments.
In each case, volatility increased because information quality decreased.
What risks do markets face when official data goes silent?
Once traditional reporting pauses, markets shift into uncertainty mode. Traders become reactive to anecdotal information. Analysts rely more heavily on weather models, which cannot fully estimate yields in stress years. Procurement teams widen safety margins. Insurers hedge more aggressively.
Without reliable in-season visibility, the market narrative becomes defensive, fragile, and easier to distort.
Why do reporting gaps matter so much for alt-data buyers?
For alternative data teams, reporting gaps aren’t just a disruption. They’re an opportunity.
The competitive edge now comes from continuity: signals that continue updating when surveys halt, when access is restricted, or when political pressures distort official data. This is where physics-based digital twins outperform legacy ag datasets. They merge satellite observations, climate dynamics, soil-moisture physics, and crop physiology into a continuously updating representation of crop development.
These models do not freeze during blackouts. They reveal stress before official agencies report it. And they provide high-frequency indicators that can be ingested directly into quant and risk pipelines.
When the official pipeline breaks, alternative data becomes the only data that still moves.
What makes agricultural alternative data truly actionable?
Alt-data only becomes decision-ready when it supports real-world workflows. Three attributes make a dataset usable during reporting outages:
Frequency: Signals must refresh fast enough to capture rapid shifts in crop momentum, weather stress, or biomass development with minimal latency.
Coverage: Data must span entire crop belts, including regions with slow surveys or restricted access.
Model depth: Surface reflectance alone is not enough. Actionable data incorporates crop physiology, soil moisture, canopy development, and stress accumulation, moving outputs from simple imagery to interpretable indicators.
Actionable datasets do more than show what the crop looks like. They show how it is responding.
What does SatYield’s signal suite include?
SatYield provides a continuously updated set of indicators designed to support both quantitative and discretionary workflows. Rather than relying on snapshots or pixel-level vegetation indices, these signals reflect underlying biological processes and environmental drivers.
The suite includes:
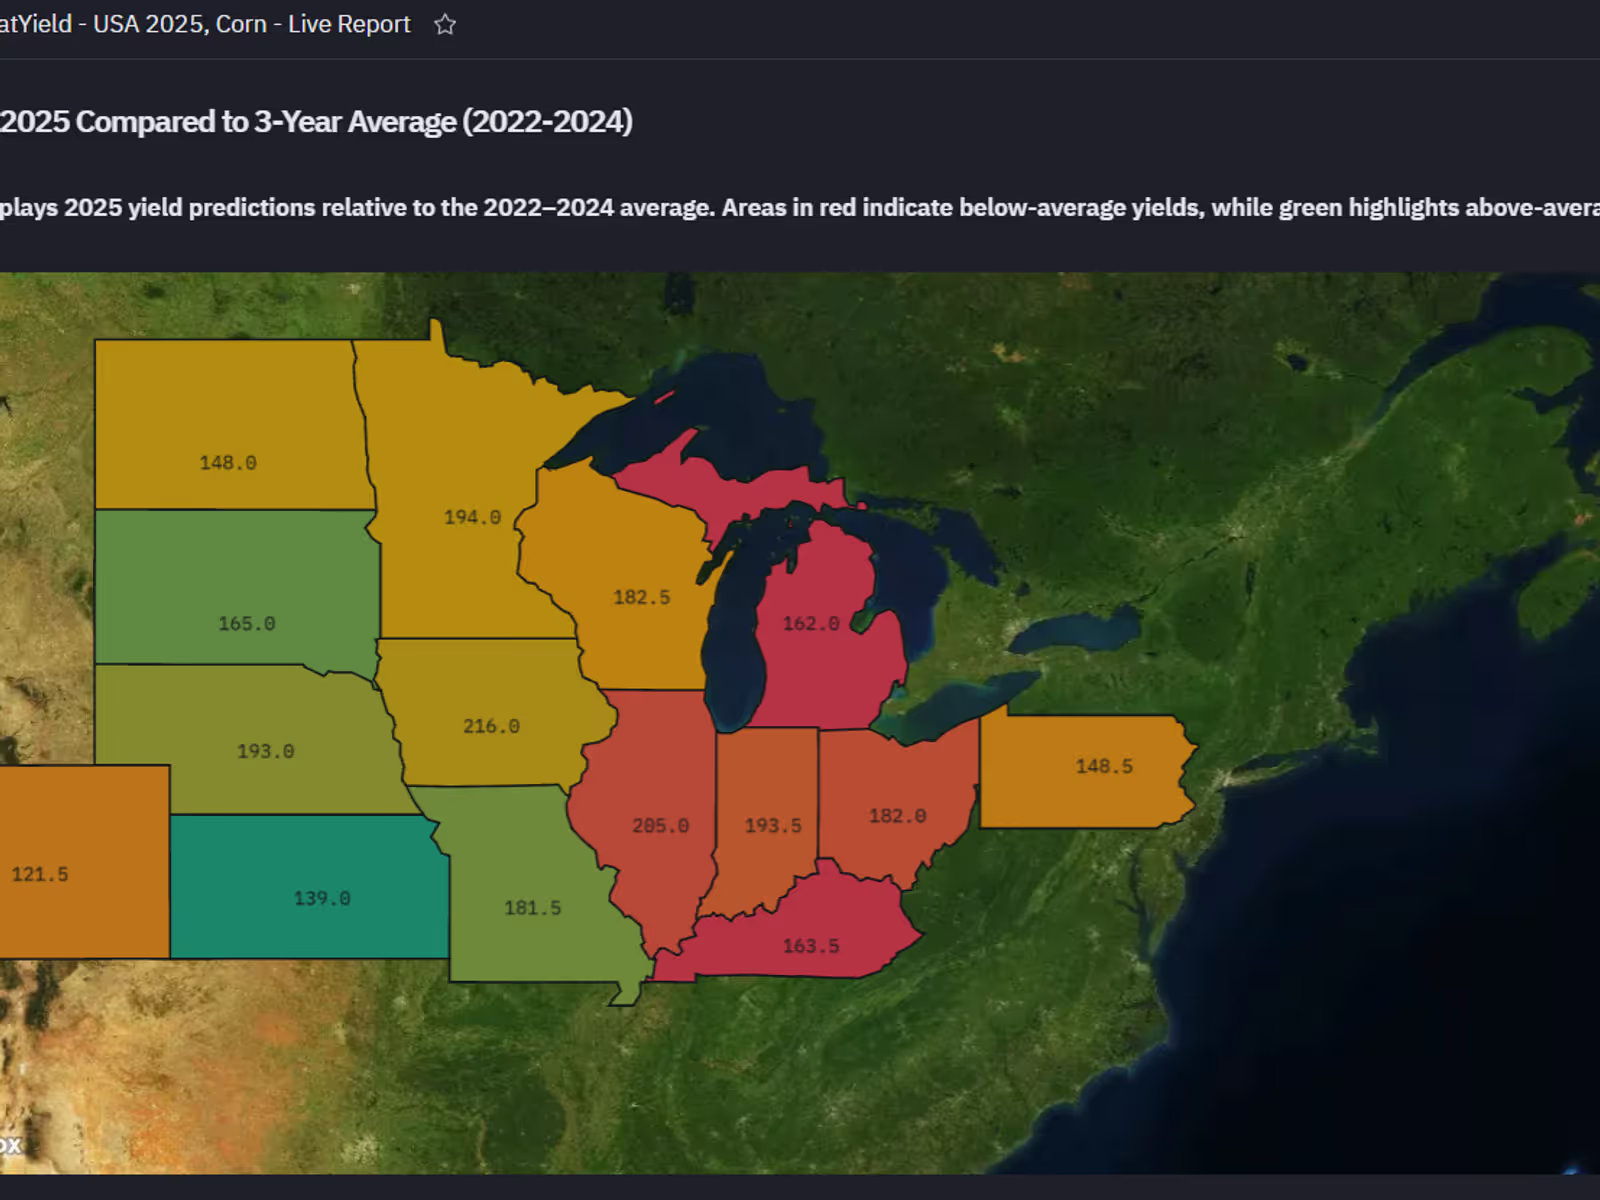
These indicators translate environmental complexity into structured, interpretable features that analysts can use immediately.
How do alt-data teams integrate SatYield signals into their models?
Integration is built around flexibility and transparency. Teams typically bring SatYield into their workflows through:
The goal is simple: frictionless ingestion, immediate usability, and clear linkages between environmental change and market outcomes.
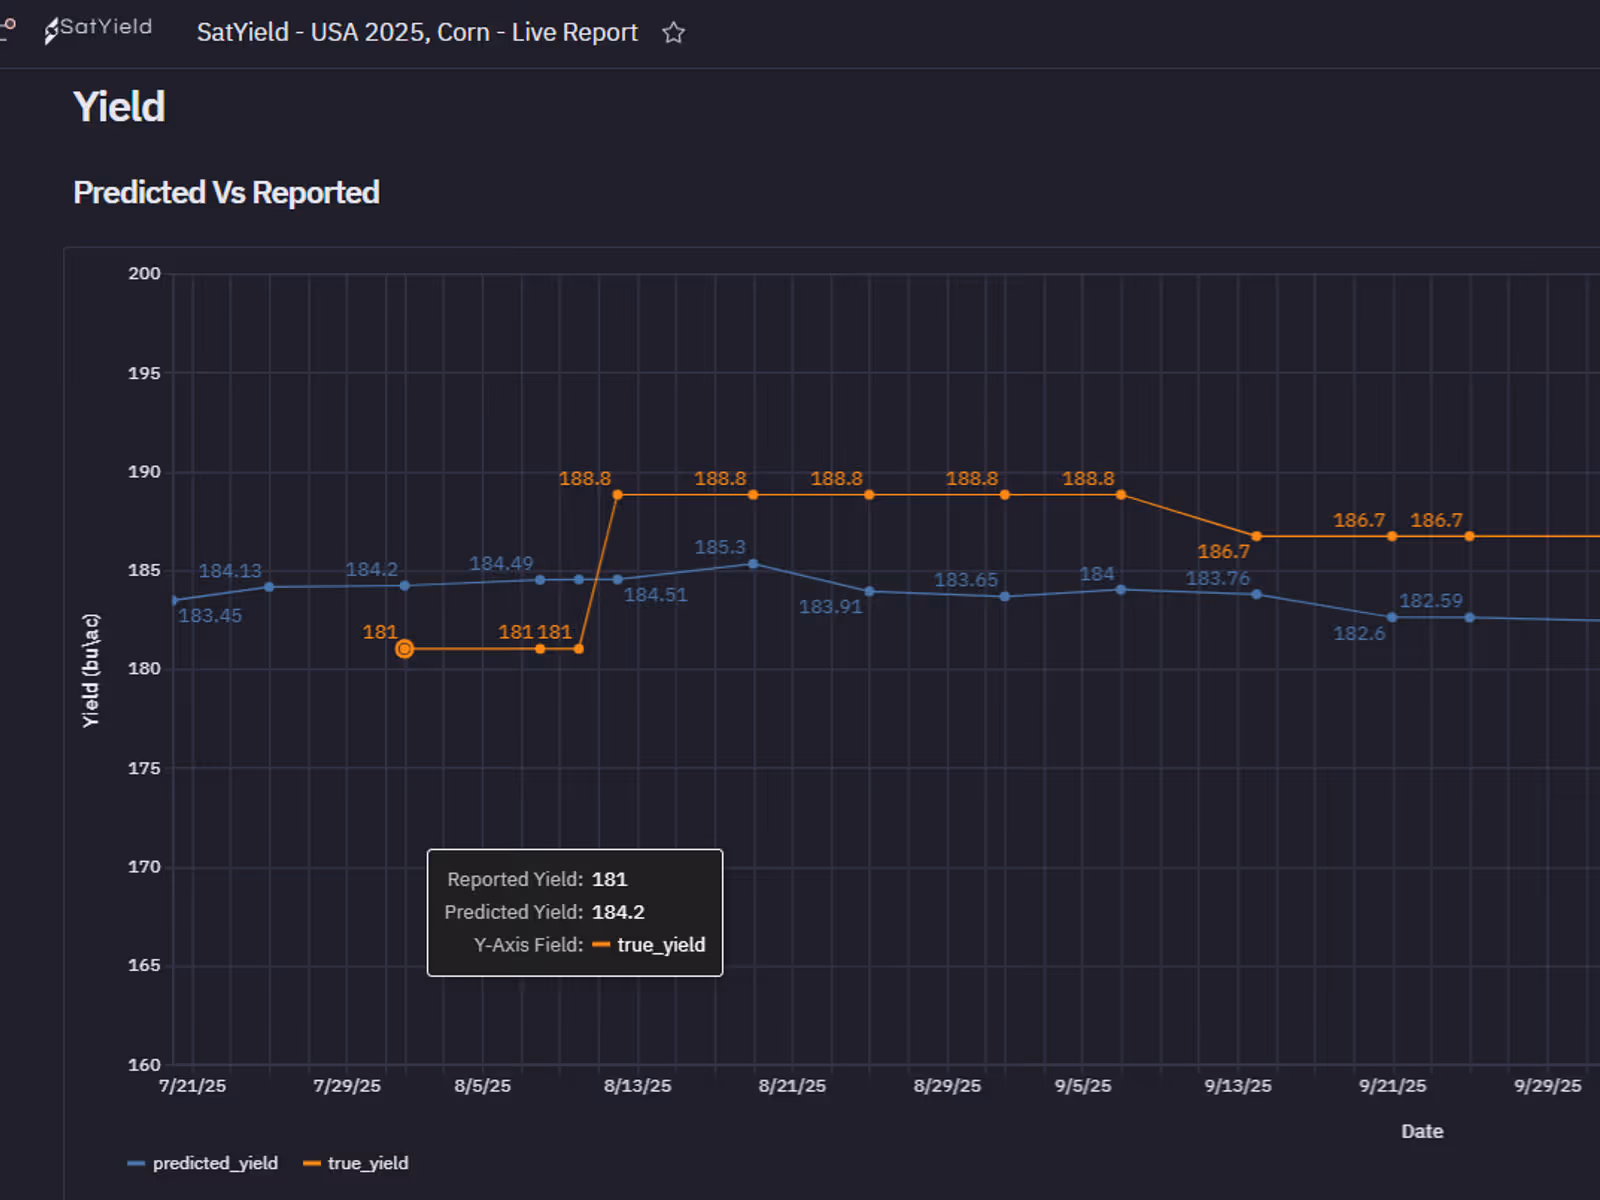
How does SatYield validate signal accuracy?
Credibility in alternative data comes from validation, not theory. SatYield uses a multi-layer evaluation framework to ensure its signals hold up across geographies and seasons:
This framework ensures that the signals are not only continuous, but reliable enough to support investment-grade decisions.
How can analysts build workflows that survive reporting blackouts?
A resilient workflow starts by identifying the last trustworthy benchmark and then shifting into high-frequency monitoring. Instead of relying on a single forecast, analysts maintain optimistic, median, and stressed scenarios and adjust them weekly. Cross-verification among satellite signals, environmental anomalies, and independent models prevents drift.
Digital twins make this approach possible, providing continuity long after traditional monitoring systems go offline.
What’s the next step for teams preparing for data outages?
As reporting gaps become more common, organizations need tools designed to withstand uncertainty. SatYield’s digital twins provide continuous, physics-based intelligence even when surveys collapse, conflict zones close, or weather blocks field inspectors.
If your trading, risk, or procurement workflows depend on in-season visibility, now is the time to prepare.
Join SatYield’s no-risk pilot and see how continuous agricultural visibility strengthens your edge when official data stops.
Your advantage begins when others go blind.
more from the blog
