Market Analysis
Why Agriculture Forecasting Needs Real-Time, Physics based Intelligence.
For decades, agricultural forecasting has been built on historical yield trends that the past can reliably predict the future. Fit a line through historical yields, extend it forward, and you have a “trend.” For much of the modern era, this approach offered stability, or at least the appearance of it.
In 2025 the limits of history-based crop yield prediction became clear as climate volatility redefined every baseline.
Why History No Longer Predicts the Future
In a recent Purdue Agricultural Economics report, the assumption that short-term yield trends are predictive has quietly collapsed. As the researchers note, “there is no assurance that the trend line using the past 10 years (2014–2023) is any more predictive of future yields in 2030 than the one based on the earlier 10-year period (1956–1965).”
In other words, the past 10 years don’t hold any special wisdom for the next 10.
The long-term (68-year) yield trend has so far remained “in the ballpark,” interrupted by extreme growing years, but those interruptions are no longer exceptions. They’re becoming the rule. Each new season writes its own climate script, reshuffling every variable that trend-based forecasting depends on.
Historical yield lines are no longer trajectories. They’re anchors to a past that no longer exists.
2025 Made It Obvious
This year turned every assumption into a stress test. Across continents, the signals of instability multiplied:
Every one of these events demonstrates the same point: the climate system traders once assumed was “averaging out” has become dynamic, non-linear, and regime-shifting.
Why Traditional Forecasting Breaks Under Pressure
When a forecasting model assumes yesterday’s climate is tomorrow’s baseline, it’s already outdated. Short-term trend lines trained on the past decade’s “normal” conditions collapse under today’s extremes. Long-term averages, meanwhile, smooth out the very disruptions that define current risk.
That’s the dilemma: the shorter your history, the less stable your trend, but the longer your history, the less relevant it becomes.
Agricultural forecasting needs to break with history, not extend it.
How SatYield Rebuilt Forecasting for the Present
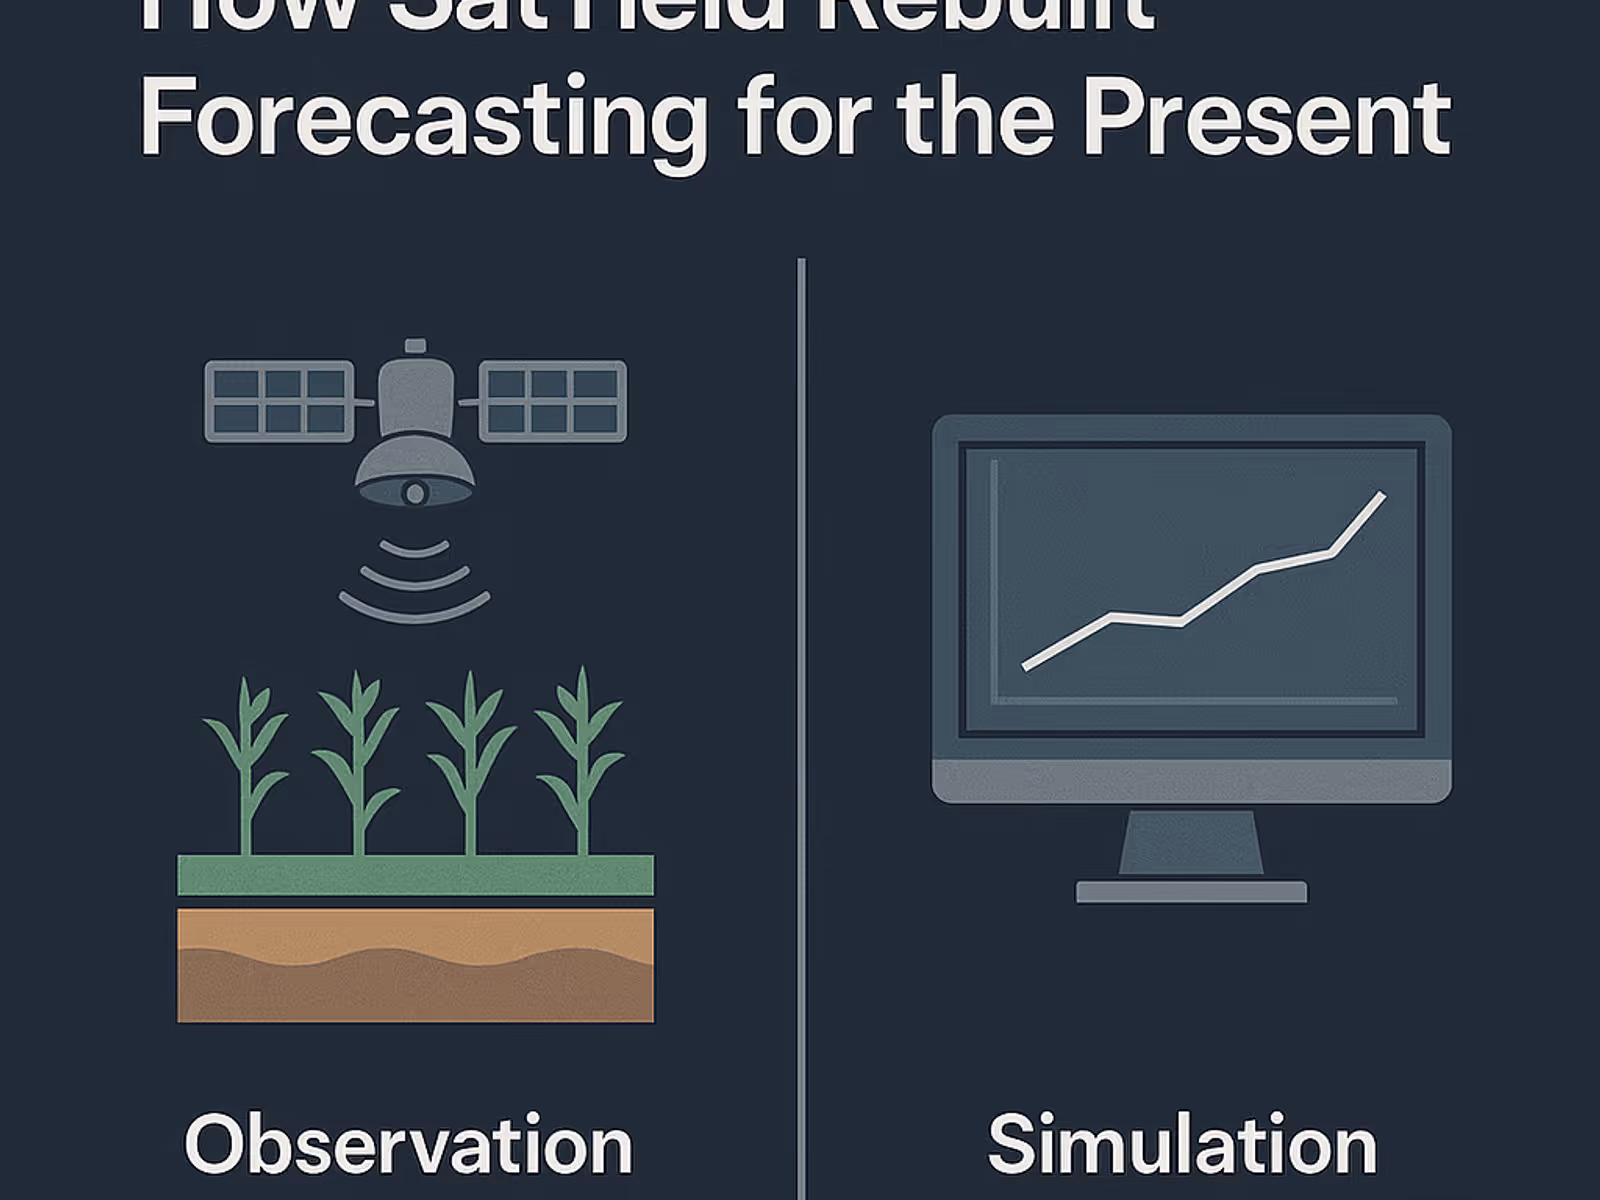
SatYield approaches the problem differently.
Rather than extrapolating from the past, the platform fuses real-time Earth observation with physics-based simulation to understand both what’s happening on the ground as well as what’s likely to happen next.
Sensing the “Now”: SatYield integrates multi-sensor satellite imagery with reanalysis data and surface observations to map canopy health, soil moisture, and crop stress as they evolve.
Simulating the “Next”: Using process-aware crop models, it conditions forecasts on today’s actual field states, then simulates forward under shifting atmospheric conditions.
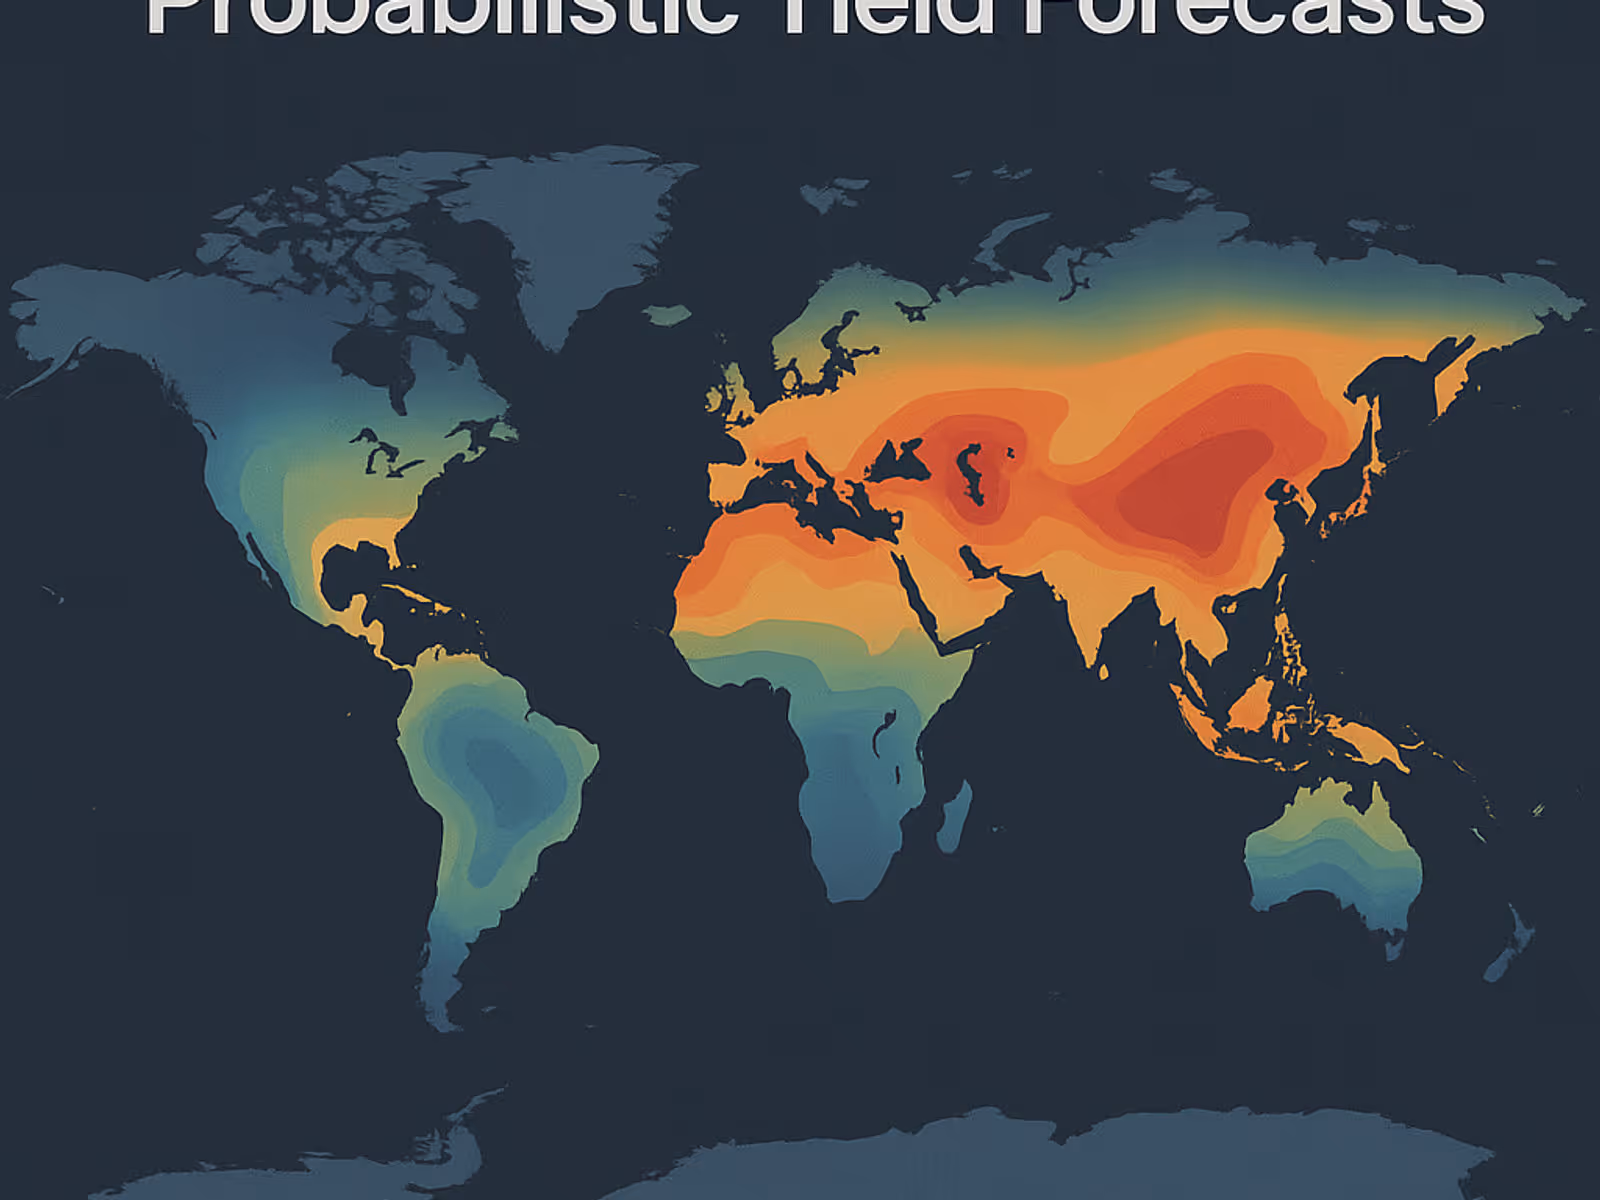
Scenarios That Move With the Weather: Each simulation generates probabilistic yield distributions that evolve as weather does. Instead of static point forecasts, users see risk envelopes that stretch or contract in near real time.
Alignment With Climate Signals: ENSO, MJO, and regional teleconnections are dynamically embedded into SatYield’s model ensembles, allowing forecasts to pivot as official climate guidance updates.
What That Delivers
Instead of relying on historical comfort, SatYield delivers actionable clarity:
It’s forecasting that adapts, not forecasting that assumes.
Real-World Validation
The proof is already visible across 2025:
Where traditional forecasts offered averages, SatYield delivered the shape — the distribution — of reality as it unfolded.
Why This Matters for Market Participants
For traders and hedgers:You gain earlier directional signals, reduced basis risk, and confidence in supply-side positions when official data is delayed or uncertain.
For food and feed companies:Dynamic regional outlooks create visibility into origin-level risks and supply assurance windows.
For growers and lenders:Localized yield stress diagnostics support smarter triage and portfolio exposure management.
These aren’t hypothetical advantages. They are operational edges born from trusting the signal in today’s data rather than the comfort of yesterday’s averages.
A New Philosophy for Forecasting
SatYield’s system is designed for a world where extremes are the new normal.It’s not about predicting the next number. It’s about understanding the next shift.
Or, as Purdue’s analysis put it bluntly: “Short trend lines can’t see the future, and long ones ignore it.”
SatYield doesn’t fit the past. It models the unfolding now.
The Takeaway
In 2025, history broke. Climate regimes are shifting faster than regression lines can adapt. Markets need intelligence that understands change as it happens.
That’s what SatYield’s Digital Twin delivers: a transparent, physics-informed simulation of global crop systems that updates with the planet itself.
Stop betting on yesterday’s averages. Start listening to what the land is signaling today. Schedule a live demo today.
more from the blog
