
Market Analysis
Shifting Weather Patterns Across the Corn Belt & Impact on Yields and Supply
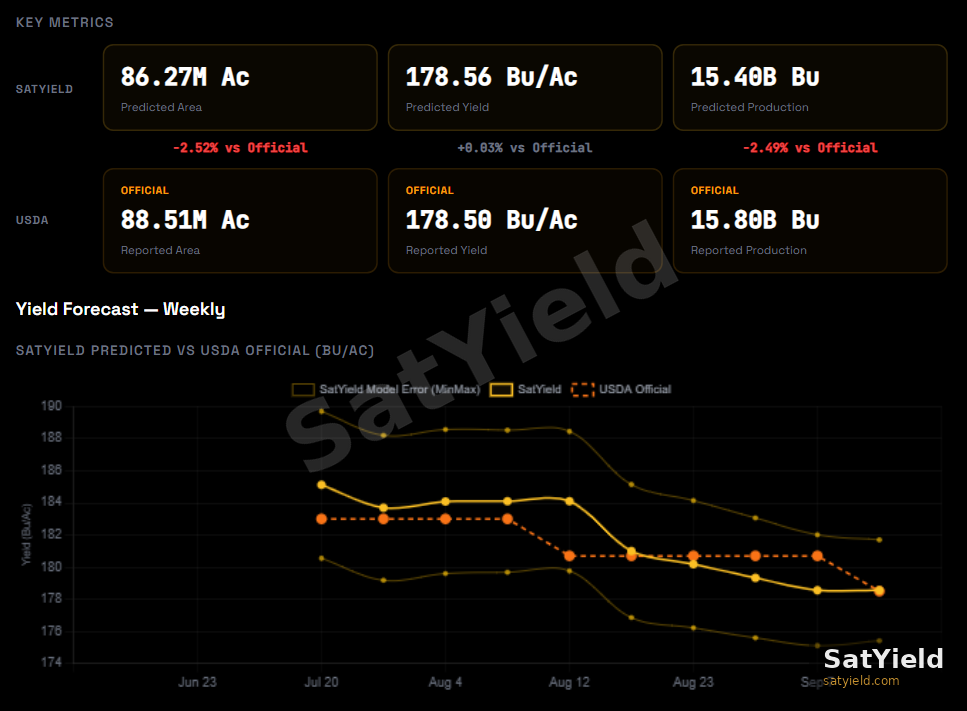
On September 7, our crop models said 178.56. On September 11, USDA said 178.5.
Key takeaways
The September 11, 2026 WASDE cut U.S. corn yield to 178.5 bu/ac, down from 180.7 in August. Our satellite model published 178.56 bu/ac on September 7, four days before the report. The gap between the two numbers is one tenth of a bushel.
The cut landed where we said it would. USDA lowered North Dakota by 12 bu/ac, Nebraska by 6, South Dakota by 6 and Kansas by 5. The northern and western belt absorbed almost the entire national revision, which is exactly the geography our satellites had been flagging since early August.
Supply tightened with it. Production fell to 15.80 billion bushels from 16.01 billion, ending stocks came down to 1.567 billion, and the season average farm price moved up to $4.80 from $4.50.
We are still 400 million bushels below the official production figure, but the reason has changed. It is no longer yield. It is acreage, where we carry 86.3 million harvested acres against the official 88.5 million.
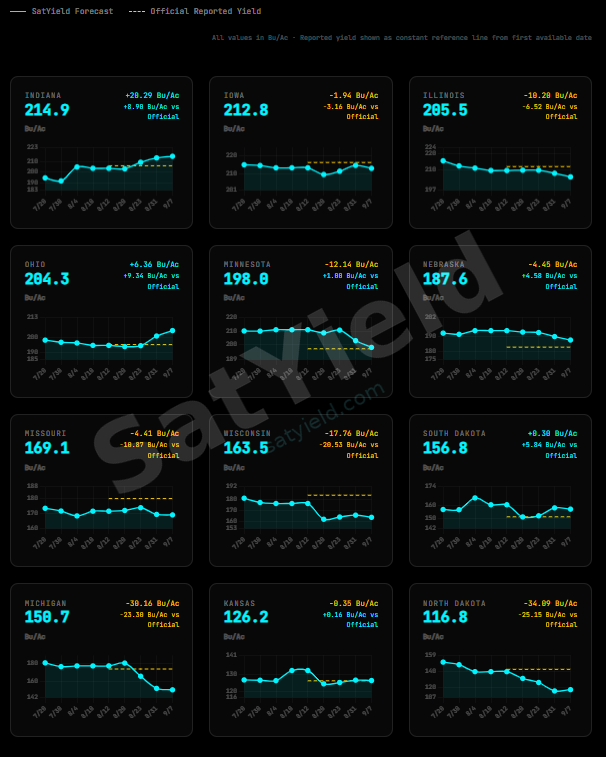
The dispersion remains extreme. Our tracked states run from Indiana at 214.9 bu/ac to North Dakota at 116.9 bu/ac, a 98 bu/ac spread inside a single crop year.
What made this season so hard to read?
Most difficult crop years have one story. It was dry. It was wet. It was cold in May. Analysts can name the villain, and models can be adjusted around it.
2026 had no villain. Areas that started wet turned dry, then turned wet again. Areas that started dry turned wet, then turned dry again. The Corn Belt did not experience a stress event this year so much as a sequence of reversals, and the sequence did not line up from one region to the next.
That is a harder problem than drought. A drought is a level. A reversal is a timing problem, and in a crop like corn, timing is everything.
Our own weekly line shows the shape of it. From July 20 through the middle of August, our national forecast held in a narrow band near 180 bu/ac, essentially agreeing with the official view at the time. Then it broke lower through late August and settled at 178.56 bu/ac on September 7. The crop did not deteriorate steadily all summer. It turned late, and it turned in specific places.
Why are alternating wet and dry cycles harder to model than a straight drought?
Most yield models, whether statistical or index-based, are built to answer one question: how far is this season from normal? They calibrate to a trend line, then apply a stress adjustment based on accumulated heat and moisture.
That approach works when stress is persistent. It struggles when stress arrives, lifts and returns, because the damage depends less on how much stress occurred and more on when it landed relative to the plant's development stage. Two counties can accumulate identical rainfall deficits over a season and finish 30 bushels apart, purely on the calendar.
This is where physiology beats correlation. A model that runs the plant forward, day by day, using observed canopy conditions and forward weather, can register that a dry stretch hit one field during pollination and another during early grain fill. A model that regresses the season against history cannot, because it has already averaged that distinction away. We have written before about why weather data alone is not enough and about the shift from pixels to physiology that a season like this demands.
Why did corn take this harder than soybeans?
The clearest evidence that this is a physiological story, not a modeling artifact, is that the two crops behaved differently all season.
Corn is determinate. It commits. Kernel number is fixed in a narrow window around pollination, and once that window closes the plant cannot go back and add rows. If conditions turn adverse at the wrong moment, the loss is locked in. Everything after that is a negotiation over kernel weight.
Soybeans are indeterminate. They keep flowering, keep setting pods, and can recover a bad three weeks with a good three weeks. August rain that arrives too late to help corn can still build a soybean crop.
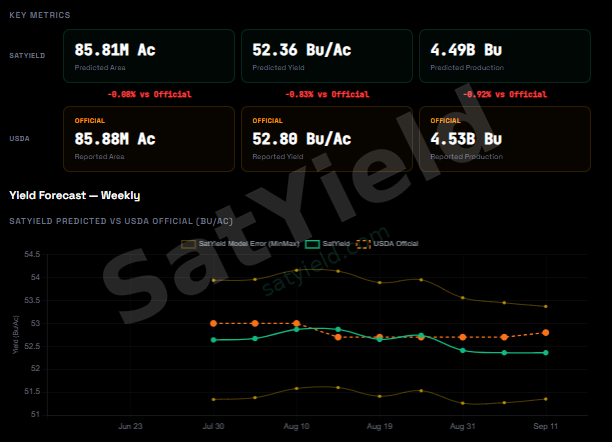
That difference shows up in both sets of books. September WASDE raised soybean yield slightly, to 52.8 bu/ac, and raised production to 4.535 billion bushels. Our soybean estimate has been sitting at 52.4 bu/ac, close enough to be inside the noise all season. Corn is where the revision happened, in both our numbers and the official ones. Same satellites, same weather inputs, same model architecture, and one crop moved while the other did not. In our view, that asymmetry is the signal.
Where did the September revision actually land?
This is where the season stops being a national number and starts being a map.
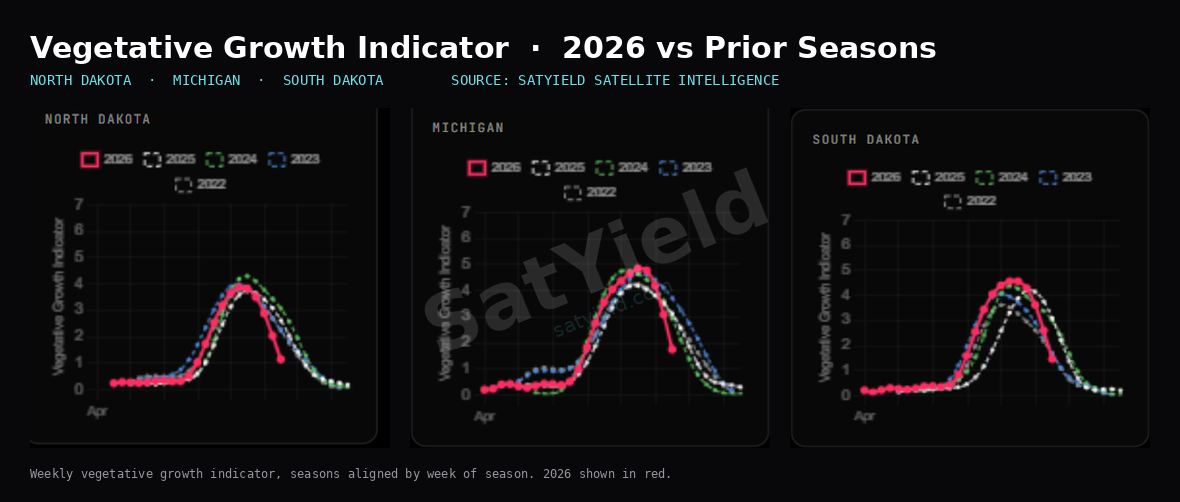
The northwestern belt absorbed the cut. USDA lowered North Dakota from 142 to 130 bu/ac, the largest state revision in the report. Nebraska came down 6 bu/ac to 177, South Dakota down 6 to 145, Kansas down 5 to 121 and Wisconsin down 4 to 180. Our satellites had been reading deterioration across that corridor since early August. North Dakota is our single largest negative deviation anywhere in the dataset at 116.9 bu/ac, down 34.1 bu/ac since our first read of the season on July 20, against a three-year average near 150.
The core held, and in one case improved. USDA raised Iowa by 3 bu/ac to 219 and Missouri by 1 to 181. Our Iowa figure of 212.8 has moved less than 2 bu/ac all season, and we now sit 6.2 below the official number there. Iowa and Illinois remain the two largest production contributors at roughly 2.64 billion and 2.22 billion bushels in our accounting.
Where we still disagree, and in which direction. We remain well below official in Michigan at 150.7 against 173, in Wisconsin at 163.5 against 180, and in Missouri at 169.1 against 181. We remain well above official in Indiana at 214.9 against 200, in South Dakota at 156.8 against 145, in Nebraska at 187.6 against 177 and in Ohio at 204.3 against 194.
Indiana deserves a note, because it moved against us. We flagged the eastern belt as the place where revisions should be muted, and USDA instead cut Indiana by 6 bu/ac. Our satellites read a crop there at 214.9, well above its three-year average near 201.7, with the largest positive move of any state since July. Either our eastern reading is running hot or the official figure has further to travel. Harvest will settle that one, and we would rather say so plainly than quietly drop the disagreement.
What was being decided in the August to early September window?
Kernel count was settled weeks ago. What was still moving into September is kernel weight, and kernel weight is set during grain fill, which for much of the belt runs from August into early September.
This is the least observable stretch of the season and the most consequential for a final number. A model can track a crop beautifully through July, correctly capture planting, emergence, canopy development and pollination, and still miss by ten bushels, because it stopped resolving the one variable that was still in motion.
It is also the stretch where the gap between continuous observation and periodic sampling is widest. The August figure was assembled before the crop finished turning. The September figure caught up. That is not a criticism of survey methodology, which remains the backbone of the market's shared reference frame, and this month's revision is a good example of the system working. It is a statement about sampling frequency, which we have explored in more detail in From Surveys to Continuous Observation.
Was heat or moisture the bigger threat to final kernel weight?
Here is where the season gets interesting, and where we would flag honest disagreement rather than pretend to a settled answer.
The conventional modeling position, and our own starting assumption, is that water is the primary limiting factor during grain fill. A plant short on water shuts down photosynthesis, cannot move sugars into the kernel, and finishes light.
There is a strong counterargument from experienced Midwest observers, and it is worth taking seriously. Temperature may matter more than moisture for final seed size, because temperature controls the length of the grain fill period. Cooler conditions slow development and extend the fill window. A crop that is dry but cool can keep filling for longer and finish with heavier kernels than the moisture deficit alone would predict. There are documented seasons where exactly that happened.
The dangerous combination is both together. Dry and hot is a double hit. Less water going in, and a shorter window in which to use it. Dry and cool is survivable. Dry and hot is not.
That framing maps onto the September revision with uncomfortable precision. The states that ran hot and dry through the critical window, across the Dakotas, Nebraska and Kansas, are the states USDA just cut. In our view this remains a hypothesis rather than a conclusion, but it is now a hypothesis with a month of official data behind it.
There is a second-order point worth noting. The Corn Belt's production center of gravity has shifted west over the past several decades. Western outcomes now carry more weight in the national total than the historical intuitions of many models assume, which is part of why a western-concentrated revision moved the national number as much as it did.
What does this mean for supply and the cash market?
The supply side tightened across the board. Production came down to 15.80 billion bushels, ending stocks fell to 1.567 billion from 1.653 billion, and the season average farm price moved up to $4.80 per bushel from $4.50. A yield revision of a little over two bushels does not sound dramatic until it runs through the balance sheet.
The physical market had already priced part of this. Basis maps for October corn delivery, converted to December futures, show the firmest bids relative to futures clustering through the northern Plains, precisely where both our satellites and now the official figures show the crop falling short. Bids across much of the western and central belt sit at the weak end of the scale, consistent with adequate local supply.
That is three independent instruments pointing the same way. Satellite observation and plant simulation from orbit. Elevators pricing what they expect to be able to buy. And now a survey-based official revision. When all three agree on the geography, the odds that any one of them is a modeling artifact go down considerably.
What is still unresolved?
Two things, and we would rather name them than let the headline match speak for the whole picture.
Acreage, not yield, is now our main disagreement. We carry 86.3 million harvested acres against the official 88.5 million. That 2.2 million acre gap is what keeps our production estimate roughly 400 million bushels below the official figure even though our yield numbers have converged. Acreage is a different measurement problem than yield, and it is one we will be writing about separately.
The eastern belt. Indiana and Ohio are the two states where we read a materially better crop than the official figures carry, and Indiana moved further away from us this month rather than closer. We are on the record there, and we will publish whichever way it resolves. We took the same approach after the August report, and we intend to keep doing it whether the comparison flatters us or not.
The broader point outlasts this crop year. In a season where the weather refused to hold still, the value of an estimate was inseparable from its latency. The crop turned in the last two weeks of August. A continuously observed model registered it in late August and published 178.56 on September 7. The official figure, assembled on a monthly cadence, reached 178.5 on September 11. Both arrived at the same place. The difference was four days, and in a market that trades on the interval, four days is the entire product. That is the argument for a real-time digital twin, and this month is the cleanest demonstration of it we have published. As we put it earlier this year, in agriculture, alpha is not information, it is time.
Our numbers are on the record, weekly, state by state, in the SatYield Live Report. The next test is the October report, and harvest after that.
Frequently asked questions
What did the September 2026 WASDE say about U.S. corn?
USDA lowered the 2026/27 U.S. corn yield forecast to 178.5 bu/ac from 180.7 in August, with harvested area at 88.5 million acres and production at 15.80 billion bushels, down from 16.01 billion. Ending stocks fell to 1.567 billion bushels and the season average farm price rose to $4.80 per bushel.
How close was SatYield's satellite forecast to the September WASDE?
Our satellite model published 178.56 bu/ac on September 7, four days before the report. The official September figure came in at 178.5 bu/ac, a difference of one tenth of a bushel. Our production estimate of 15.40 billion bushels remains below the official 15.80 billion, because we carry lower harvested acreage at 86.3 million acres.
Which states saw the largest September yield revisions?
North Dakota was cut 12 bu/ac to 130, the largest state revision. Nebraska and South Dakota were each cut 6, to 177 and 145. Indiana was cut 6 to 200, Kansas 5 to 121 and Wisconsin 4 to 180. Iowa was raised 3 bu/ac to 219 and Missouri 1 to 181.
Why does corn respond differently to weather stress than soybeans?
Corn is a determinate crop. It sets kernel number in a narrow window around pollination and cannot compensate later. Soybeans are indeterminate and continue flowering and setting pods, which lets them partially recover from a poor stretch. This is why the same weather can produce a normal soybean crop and a below-normal corn crop in the same field.
Why is the August to early September period so important for corn yield?
Final kernel weight, or seed size, is determined during grain fill, which falls in that window for most of the Corn Belt. Models that track the crop accurately through July can still miss the final number because the last significant yield variable is still moving after their observation stops.
Does hot weather or dry weather hurt corn yield more during grain fill?
Both matter, and they interact. Moisture stress limits sugar movement into the kernel, while heat shortens the grain fill period itself. Dry and cool conditions can still produce acceptable kernel weight because filling continues longer. Dry and hot conditions combine both effects and are the more damaging scenario.
See how SatYield tracks the U.S. corn and soybean crop week by week, state by state, with no reporting lag. Explore the SatYield AI Agent.
A closing note in my own voice. I came to agricultural intelligence from outside the industry, and I am still learning it. A one tenth of a bushel match on a national yield figure is a good week, and I am wary of reading too much into a single month. We were also further from the mark in Indiana and Iowa than I would like, and that is in this post too. What I take from September is narrower than a victory lap: in a season this erratic, measuring continuously got us to the right number before the calendar did. If you see something here that does not match what you are seeing in the field or in your own book, I would like to hear it.
more from the blog