
Market Analysis
A Record Soybean Crop, Independently Confirmed And Corn Number Worth Arguing About
The USDA's August crop production report landed on August 12 with a headline that carried across the trade press: U.S. soybean production is on track for a record 4.519 billion bushels, on 85.781 million harvested acres and a yield of 52.7 bushels per acre. Corn, on 88.592 million harvested acres at 180.7 Bu/Ac, comes in at roughly 16 billion bushels — the second-largest crop on record.
Those are good numbers, and they were reported as fact. But they arrived from a single source, built the way USDA has always built them: grower surveys, historical relationships, and a monthly publication calendar.
SatYield measured the same crop, in the same weeks, a different way — satellite observation of the physical field, extended forward with 5-day to 2-week weather. No survey, no enumerators, no revision cycle. We published on August 10, two days ahead of the WASDE, and we published the estimate the model produced rather than a guess at what USDA would print.
Here is what the two readings look like side by side.
Soybeans: the record holds — and may be slightly larger
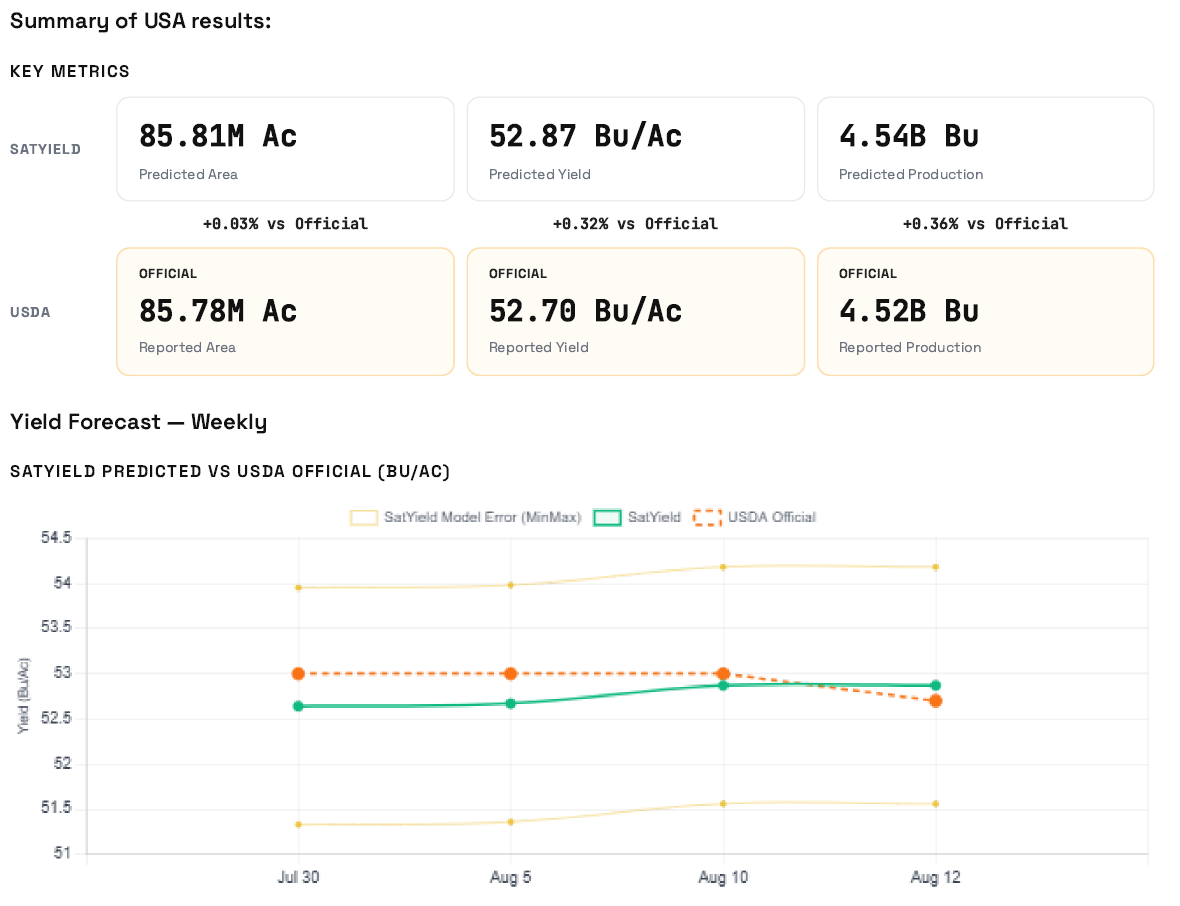
Two independent measurement systems, 16 million bushels apart on a 4.5-billion-bushel crop. In practical terms, they agree.
That agreement is the story. The record soybean number is not a survey artifact and not a modeling quirk — it shows up in the satellite record too, from an entirely separate chain of evidence. If anything, the physical crop reads marginally larger than the official estimate.
The satellite estimate has also been firming, not swinging: 52.64 Bu/Ac on July 30, 52.87 by August 12. Monotone, no step-changes, no reconciliation jumps. That is what convergence looks like in a maturing crop.
Where the two disagree is more interesting than where they agree. Illinois is the sharpest case. USDA carries Illinois soybeans at a record 67 Bu/Ac. SatYield reads 63.10 — 5.8% lower, and the largest single-state gap in the soybean book. Nebraska shows the same sign at 61.98 against USDA's 65.5, and South Dakota sits 9.5% below USDA at 42.54 Bu/Ac — the only major state where our satellite estimate falls below its own three-year average, which points to genuine localized stress rather than modeling noise.
Running the other way: Kansas at 42.33 Bu/Ac is 11.4% above USDA and well clear of its 36.66 three-year average — a real recovery year. Ohio (+4.6%) and Indiana (+4.0%) also read stronger from orbit than from the survey.
The national totals match. The map underneath them does not. For anyone pricing basis or positioning by region, that second fact is the one that pays.
Corn: same crop size, different route to it
Corn is where the exercise gets genuinely useful.
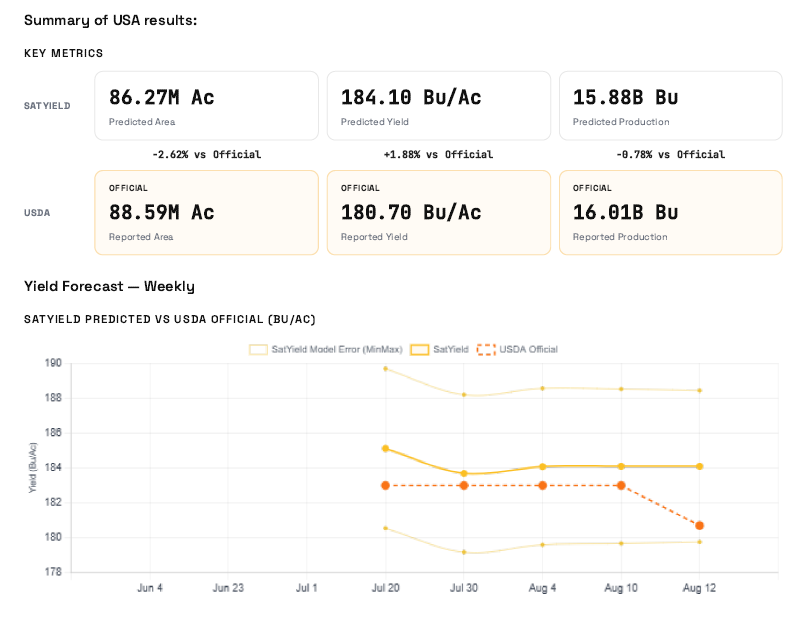
SatYield reads corn yield 3.4 bushels per acre higher than USDA, and harvested area 2.3 million acres lower — and still lands within 0.78% on production. Two errors in opposite directions could produce that. But so could two independent systems converging on the true crop size while disagreeing about how it decomposes.
The disagreement is therefore not about production. It is about acreage, and it is specific enough to be testable.
The standard counterargument from the trade is a fair one: USDA's acreage number is more likely to be revised modestly higher than lower, as farmer certification data comes in through FSA. That is probably right — and it is worth being precise about what it means, because the two numbers in question are not the same number.
Certification data speaks to planted acres. Our figure is harvested-for-grain acres. The gap between the two is abandonment, failed acres, and corn cut for silage rather than combined for grain. Planted acreage can revise upward on certification while harvested-for-grain still comes in below the current official figure — particularly in a season where input costs were high enough to make silage economics look attractive on marginal fields. Those two claims are compatible, and only one of them is settled.
On yield, the state pattern is consistent enough to be worth noting on its own. Minnesota reads 211.0 Bu/Ac against USDA's 197 (+7.1%). Nebraska: 193.6 versus 183 (+5.8%). South Dakota: 160.2 versus 151 (+6.1%). Kansas: 132.1 versus 126 (+4.9%). That is a coherent upside signal across the western Corn Belt and central Plains, not scattered disagreement. Iowa, meanwhile, comes in at 213.1 against USDA's record 216 — close enough that the satellite record broadly supports the record claim there.
The national corn estimate has been flat at 184.1 Bu/Ac since August 10, across two consecutive weekly updates.
Why publish a number that disagrees
The most common question we get is why SatYield doesn't simply tune its output toward the USDA print. The answer is that it would destroy the only thing the data is good for.
USDA's August estimate is a benchmark, not a verdict. August numbers have been revised substantially in both directions in past seasons. A model trained to match the August print inherits every bias in the August print and adds nothing. It becomes a forecast of a forecast.
What we publish instead is what the model produces: an end-of-season estimate of where the crop finishes, built from the physical state of the field as observed from orbit and extended with near-term weather. It updates weekly, including in the weeks USDA does not publish. It carries no survey response bias, no filing calendar, and no blackout period.
That independence is the entire product. The August comparison shows it is calibrated: close enough on production that the two series corroborate each other, different enough at the state level to be worth having both.
The soybean record is real, and satellite data supports it. The corn acreage question is open, and we will keep publishing our answer weekly while it resolves. Soybeans and wheat we are watching closely over the next several weeks to see where the trend settles.
join our Beta AI Chat Agent - You can check our work against the official series as the season closes: https://www.satyield.com/ai-agent
Figures from SatYield USA 2026 Corn and Soy Live Reports, published Aug 10, 2026, alongside the Aug 12, 2026 USDA WASDE. SatYield estimates are independent, satellite-derived model output and should be verified against official sources before use in trading decisions.
more from the blog