Market Analysis
Grains for Thought: Post-USDA September 2025 Crop Production Report
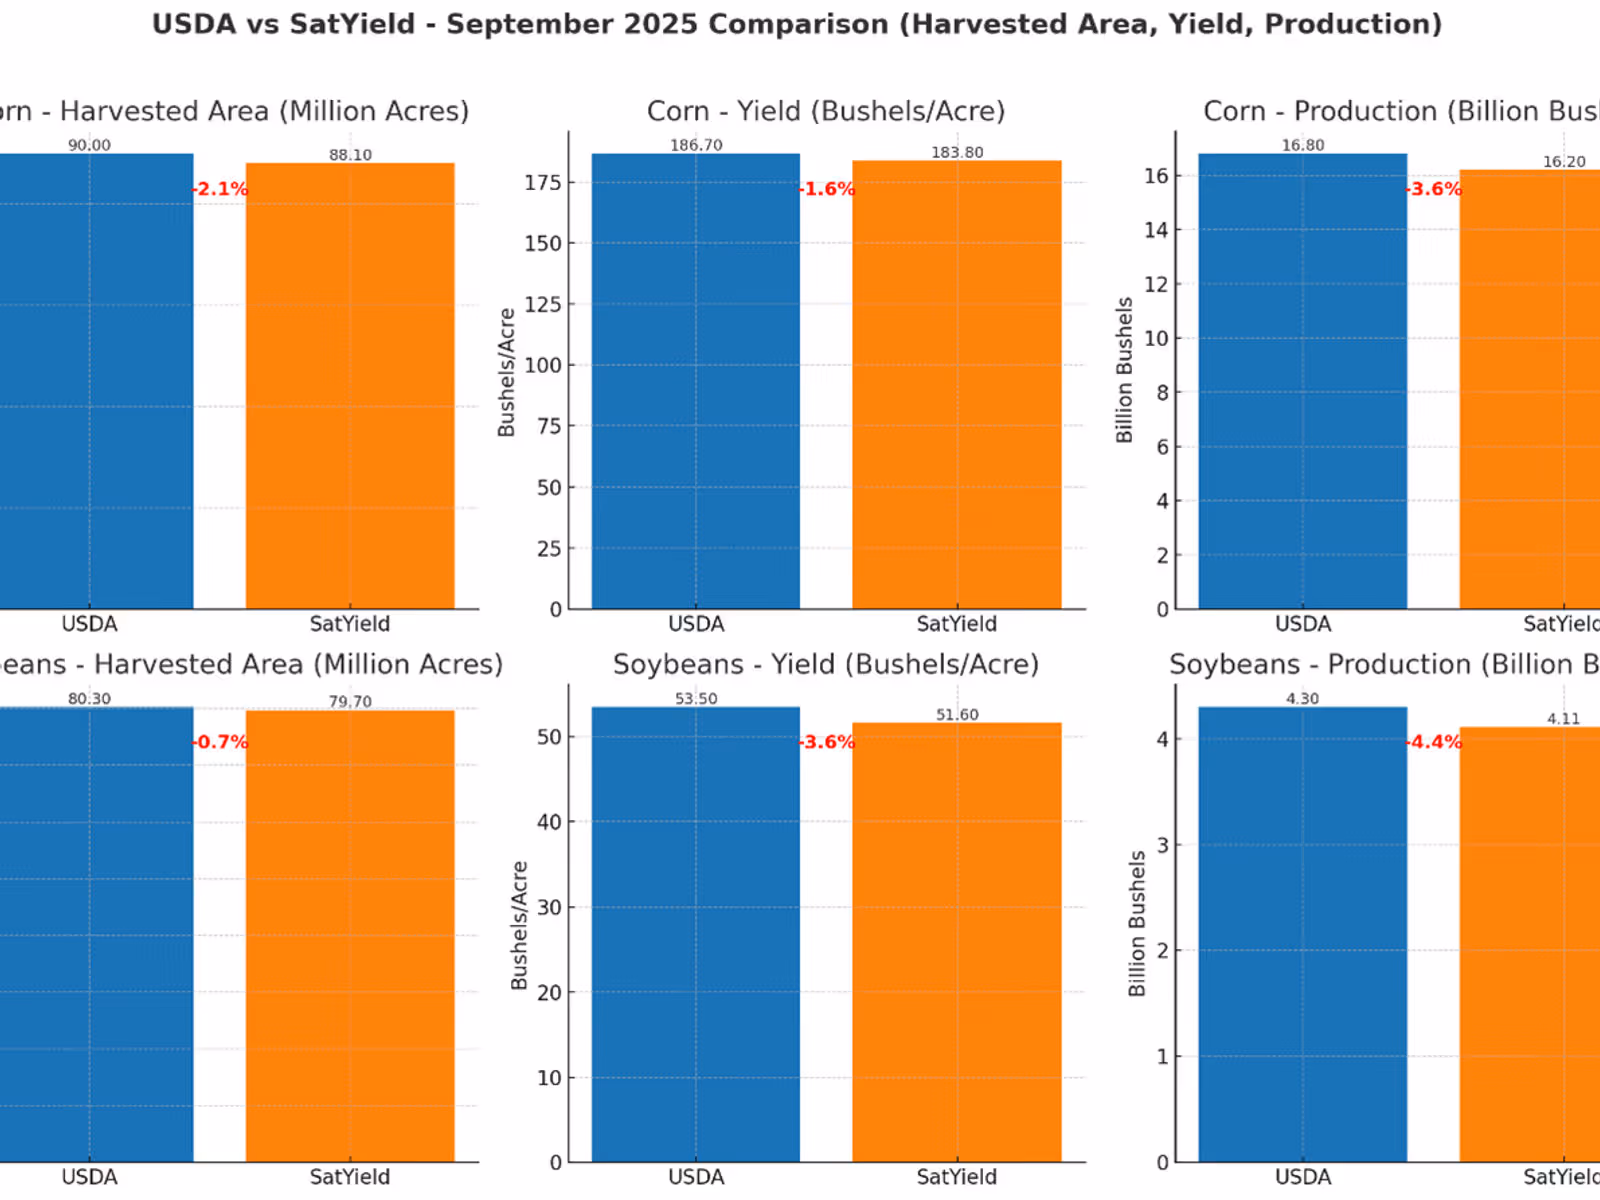
The September 12, 2025 USDA Crop Production Report landed with big headlines: record acres and record yields for both corn and soybeans. But are those numbers too optimistic? SatYield’s independent satellite-based crop models provide a crucial counterpoint.
Here’s how the two perspectives compare:
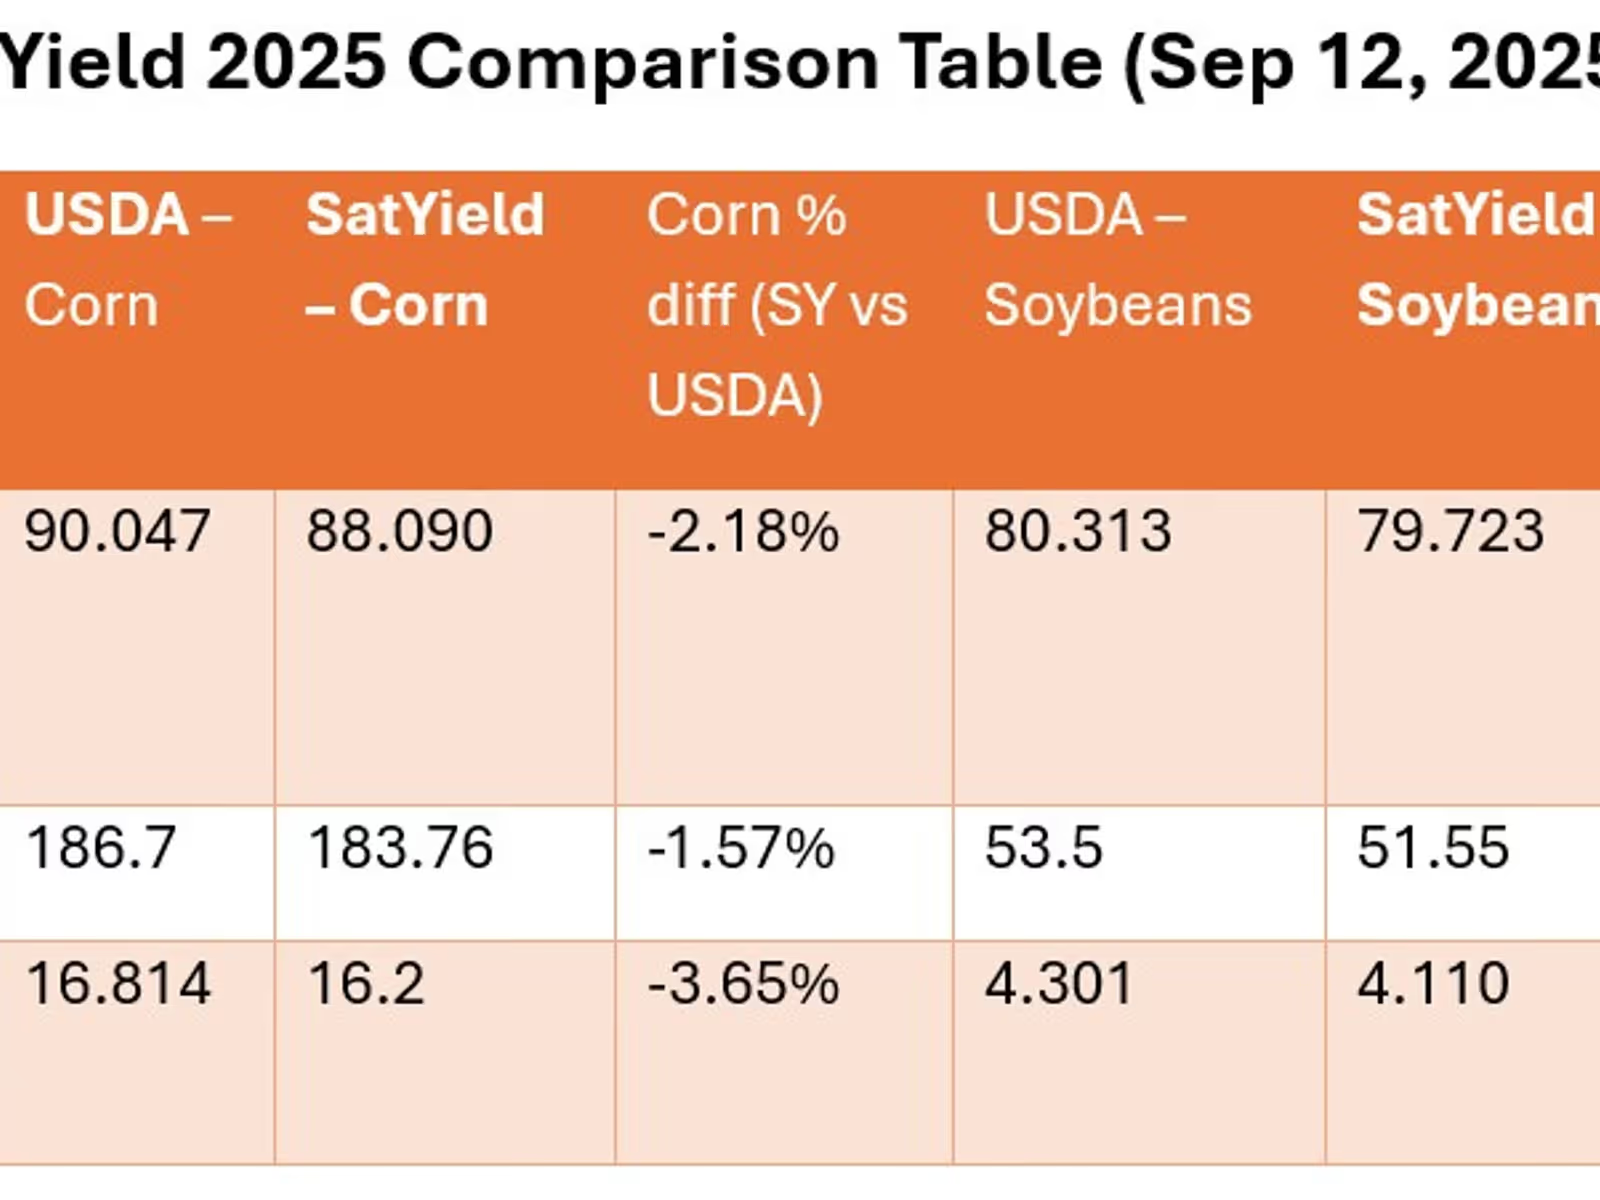
The numbers show alignment in broad trends, but SatYield consistently comes in lower, especially on soybean yields. That’s a gap that could shape fall markets.
Corn: Record Crop, But How Big?
The USDA’s September outlook paints corn as a record-setting crop across the Midwest, but SatYield’s digital twin models suggest that story is more nuanced.
In short, both perspectives confirm corn’s strength, but SatYield’s lower estimates shave nearly 600M bushels off USDA’s projection. That difference could be the dividing line between burdensome carryout and a more balanced supply outlook.
Soybeans: Tight Acres, Questionable Yields
Soybeans tell a different story. One of limited acres and potential overconfidence in yield forecasts.
With acreage already down 7% year-over-year, soybeans don’t have much room for error. SatYield’s lower projections imply nearly 190M fewer bushels than USDA, a difference that could tighten the stocks-to-use ratio and keep a risk premium alive in soybean markets.
Why the Gap Between USDA vs SatYield
Some divergence is expected, but the reasons behind these gaps matter.
These differences highlight the value of combining survey-based and remote-sensing perspectives: USDA gives structure, SatYield surfaces real-time shifts.
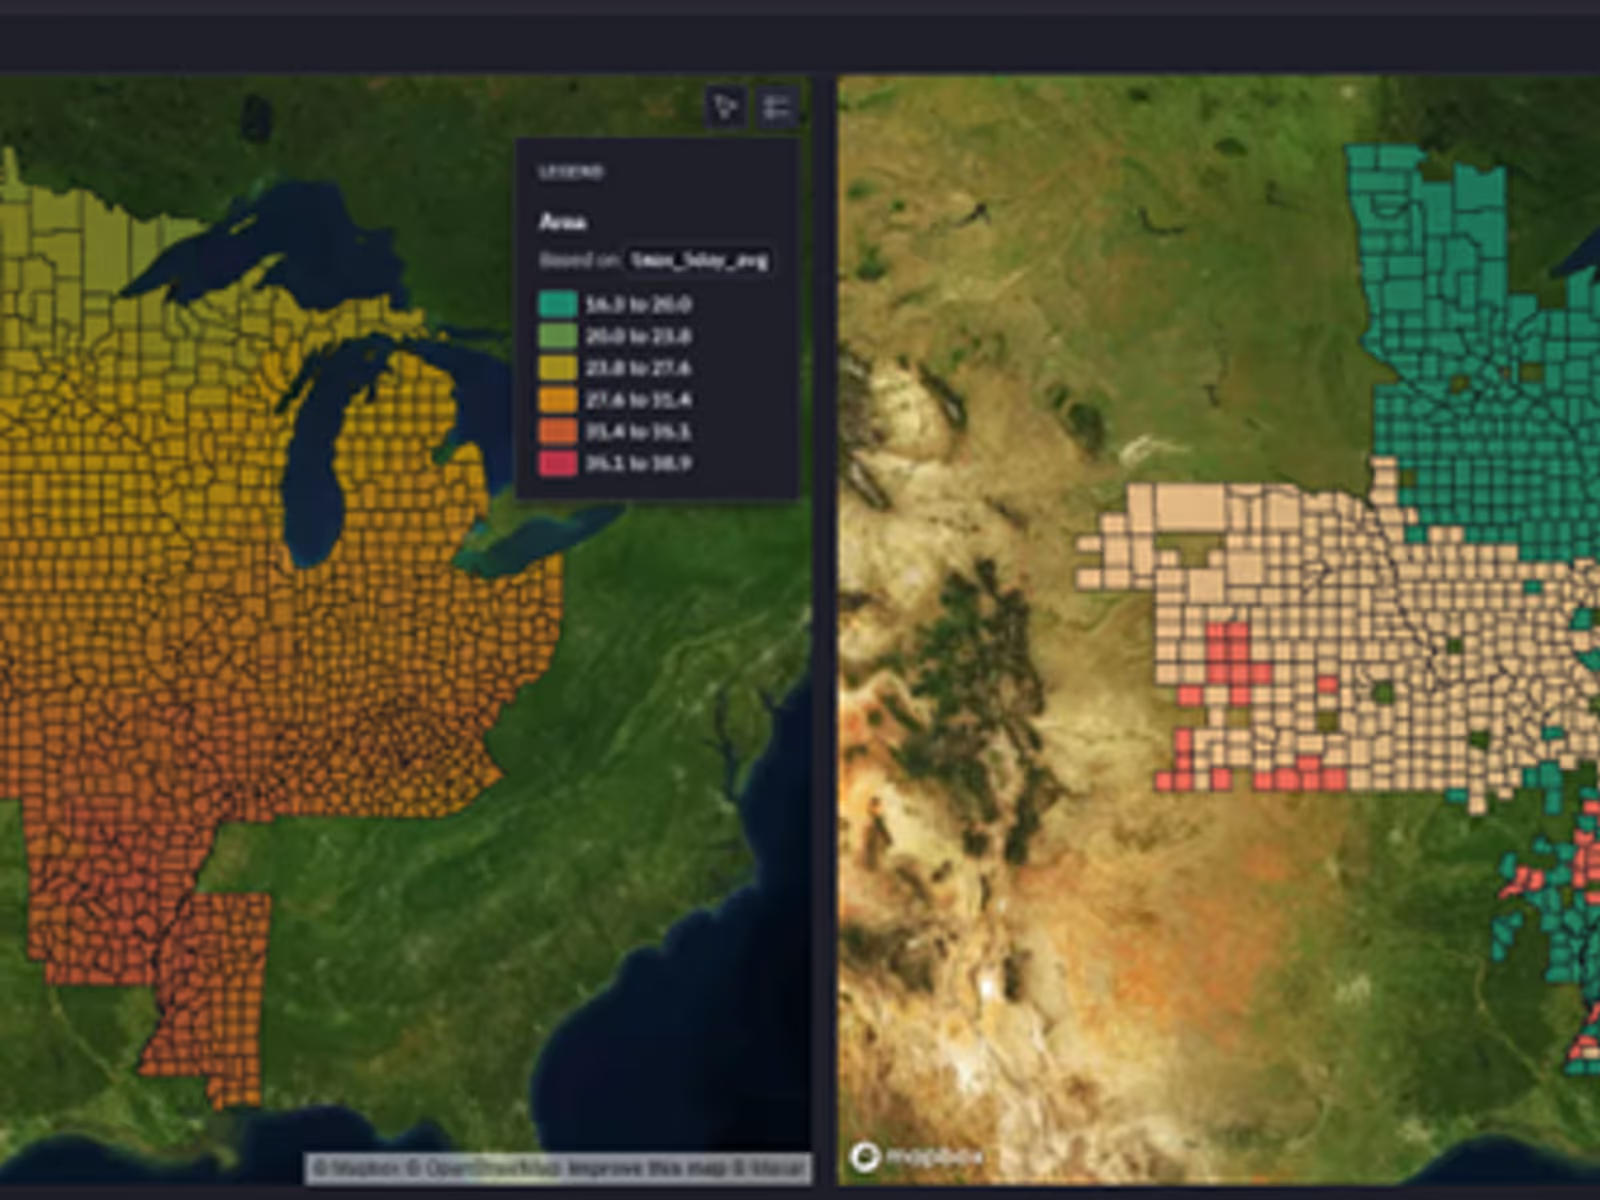
Weather and Risk Factors
Weather risk remains the wild card, and SatYield’s continuous monitoring highlights where stress is already showing up.
This means the risk isn’t evenly distributed. Soybeans in particular face more downside pressure tied to September heat stress.
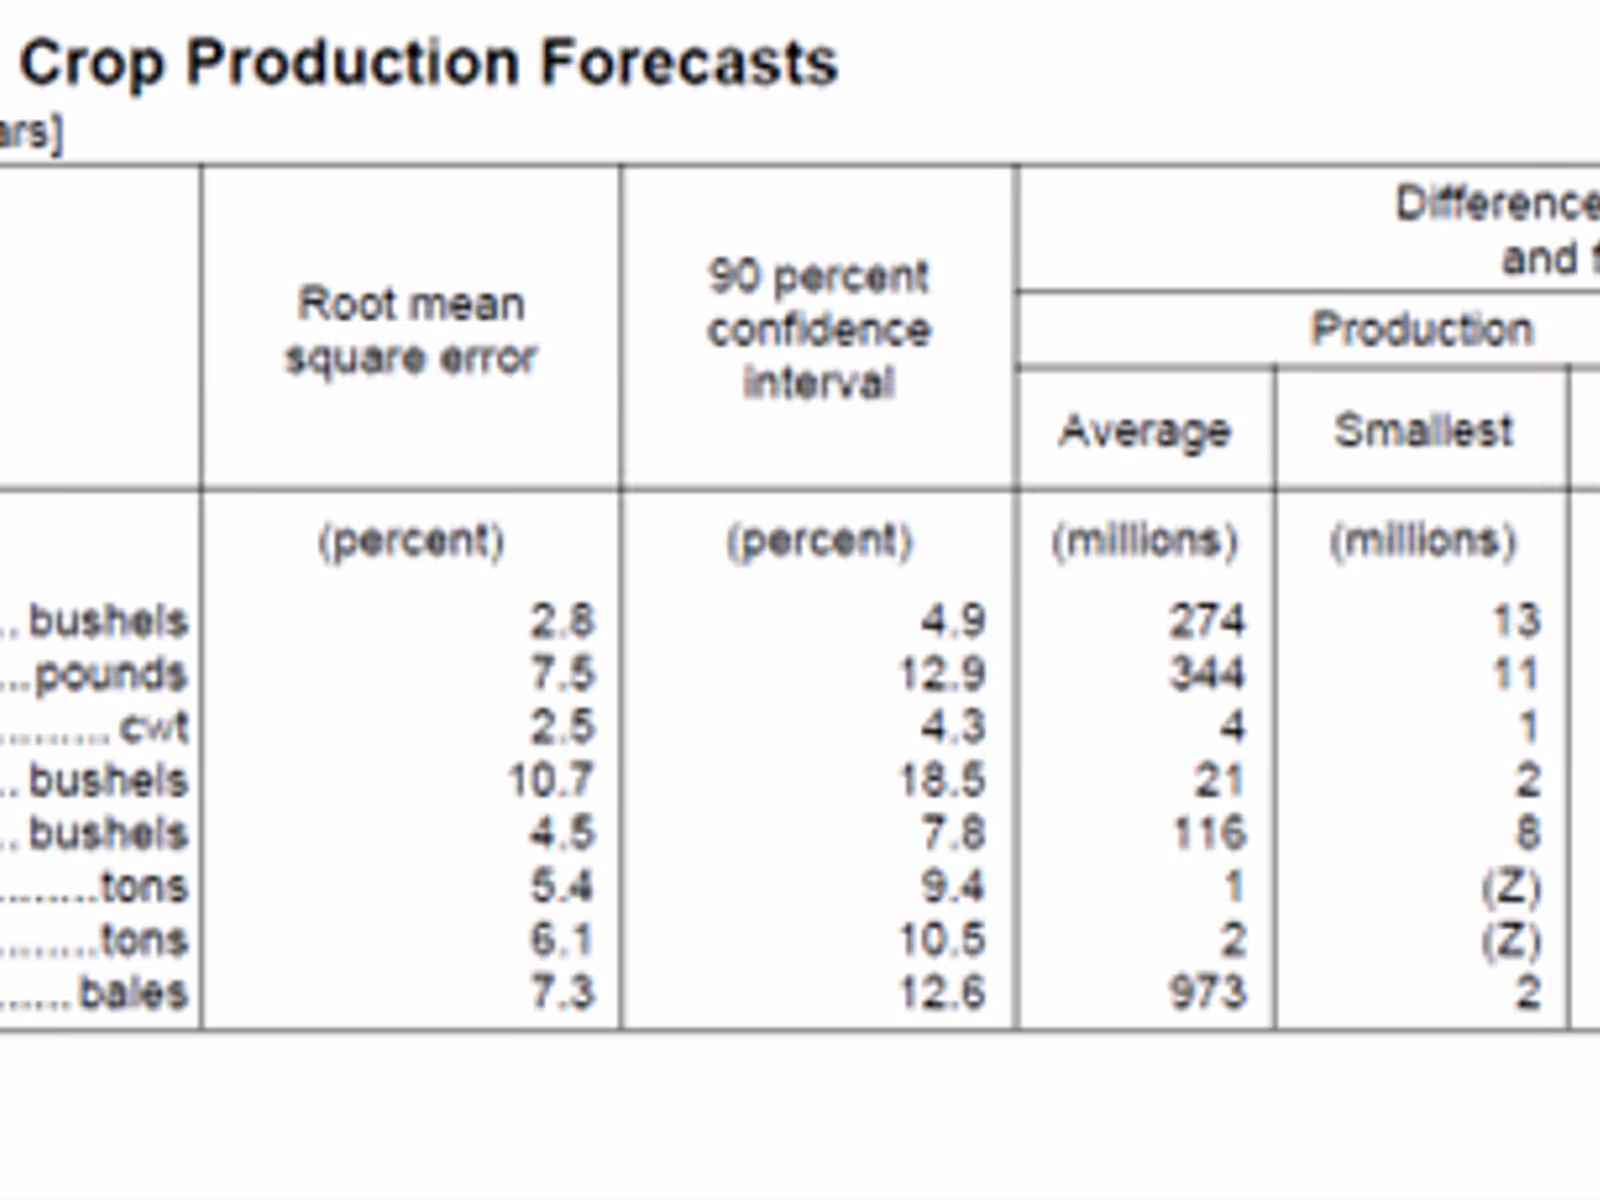
How Reliable Are USDA September Forecasts?
Looking at the track record helps frame these forecasts in context.
Taken together, USDA corn numbers usually hold up well. Soybean forecasts, however, are more volatile, making SatYield’s lower acreage and yield estimates particularly relevant this year.
Additional Insights from USDA + SatYield
Market Implications
What does this all mean for markets heading into fall?
Corn appears stable. Even SatYield’s lower numbers fall within USDA’s typical error range. The record crop is real, though likely a touch smaller than the USDA headline.
Soybeans are a different story. Between fewer acres, late-season heat stress, and SatYield’s more conservative yield estimates, downside risk is alive and well. Markets are right to keep a risk premium in soybeans, even as corn feels cushioned.
Big Picture: September USDA reports are reliable indicators, but not precise instruments. When we overlay SatYield’s remote-sensing data and weather maps, the gaps highlight where risk is still alive.
This is the essence of “grains for thought”: not taking USDA or SatYield in isolation, but triangulating between them to hone in on the most accurate numbers.
Disclaimer
All figures are estimates based on USDA reports and SatYield satellite-based models. They are provided for informational purposes only and should not be interpreted as investment, trading, or marketing recommendations.
more from the blog
