Status: running
The SatYield Engine
End-to-end biophysical processing and predictive modeling architecture for global agricultural yield forecasting.
Brazil Safrinha forecast
avg_pace106.5 MMT
Lead time
network_ping23 Days
Accuracy
account_tree1.7% Error
Satellite Imagery Acquisition
DATA FUSION ENGINE
10M/PXL OPTICAL RESOLUTION
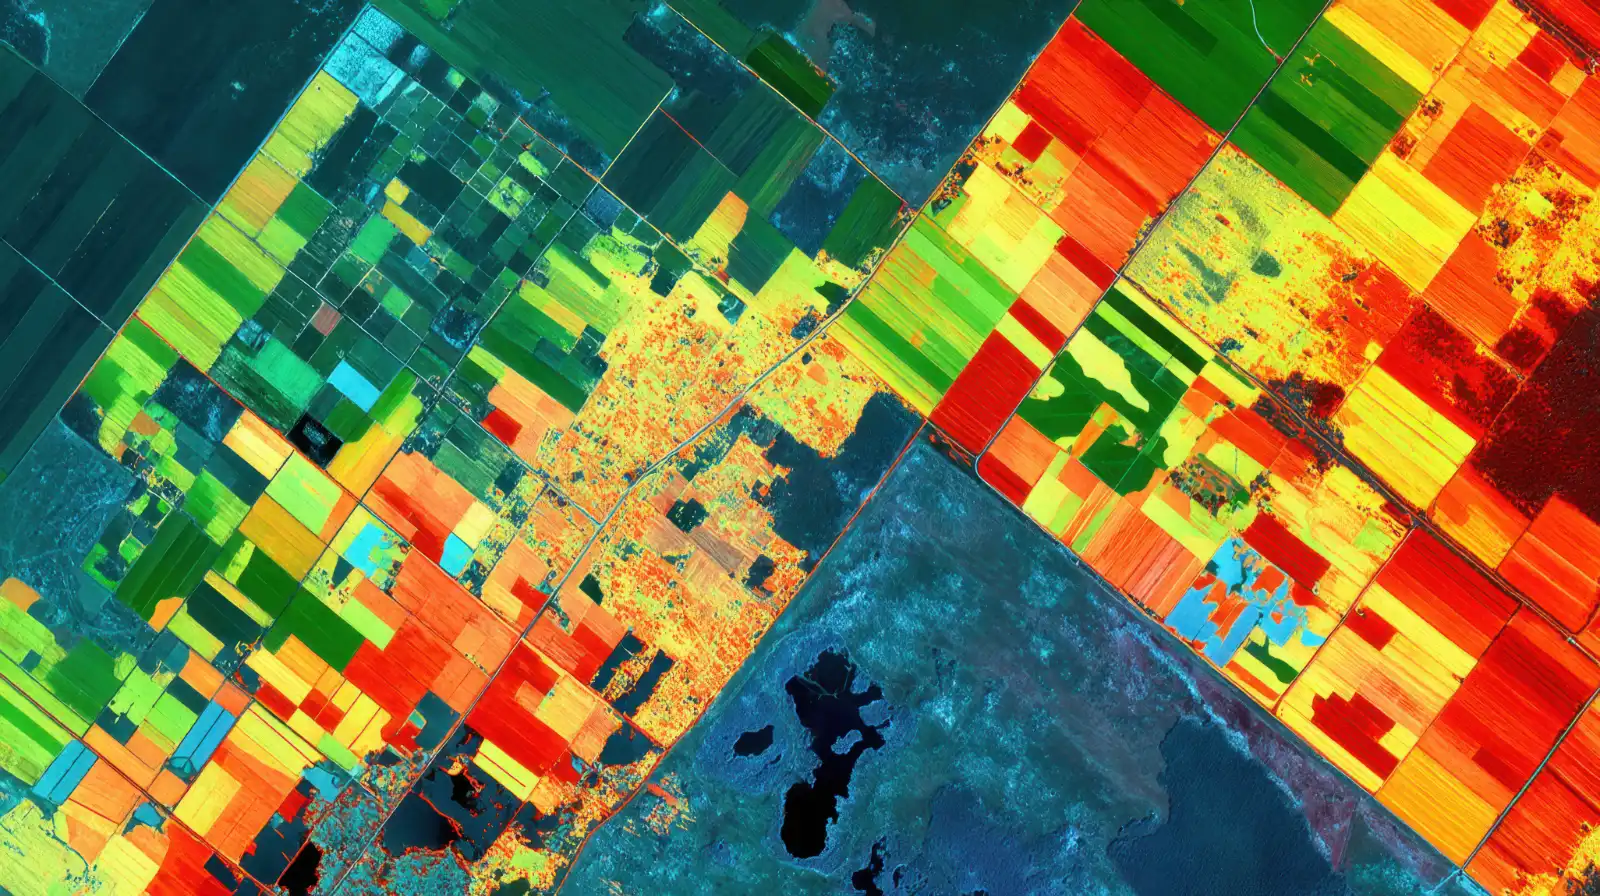
Phenology & Stress
VI/LAI CONFIDENCE
90%
Digital Twins
Yield Modeling
CONFIDENCE INTERVAL
±0.2
Area Mapping
Regional Aggregation
Production Signals
Pushing to API V2.1...
98% SYNC
Digital Twin Engine Active
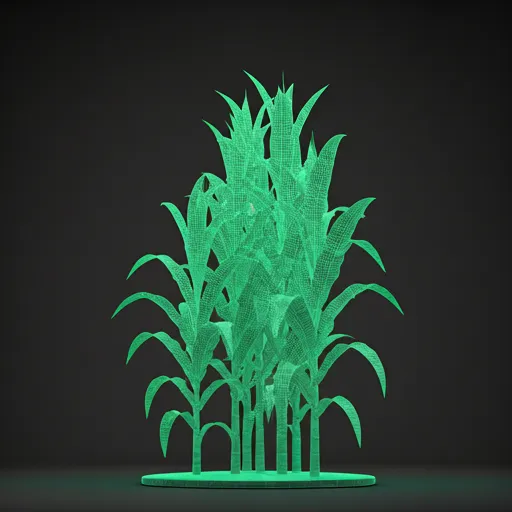
Biophysical-Based
Digital Twins
Comprehensive biophysical-based cropsimulations coupled and powered by high spatio-temporal satellite imagery andadvanced weather models to crate a digital replica of the monitored crops.
Weather
Daily, weekly, and monthly climate variables
Temperature, precipitation, radiation, and wind.
Historical and in-season forecasts.
Soil
Soil type, characteristics and texture
Plant-available water eastimation and retention characteristics.
Seed and Crop Parameters
Crop type and cultivar characteristics
Phenological and physiological constraints.
Remote Sensing
Optical and SAR satellite earth observations
Vegetation dynamics and structural chemical properties.
Biophysical Crop State Outputs
The digital crop twins generate structured, time-series outputs including:
Output Stream Status: Synchronized
Stream_01
analyticsCrop yield estimates
Stream_02
water_dropSoil moisture and plant-available water
Stream_03
grassPlant biomass accumulation
Stream_04
nest_multi_roomLeaf Area Index (LAI)
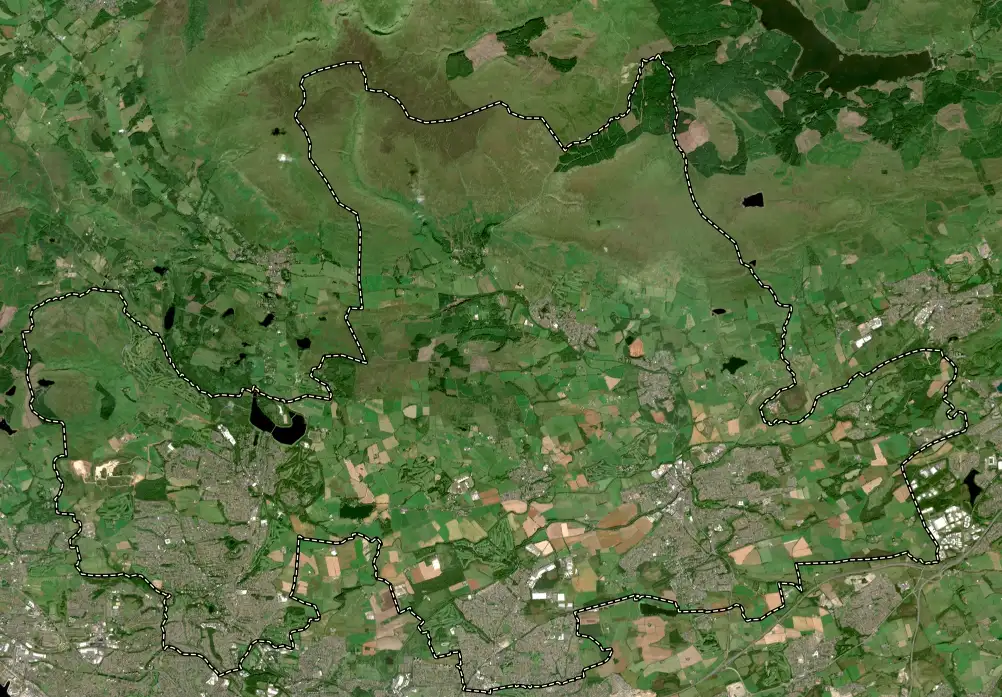
Measure what is planted and harvested, before it reaches consensus
SatYield measures planted and harvested area directly from high-spatio-temporal Earth Observing satellites, capturing crop activityas it unfolds and revealing supply shifts before surveys and market consensusadjust.
High-Resolution
Satellite Imagery
AI Algos
Deep Learning on Every Dot on Earth
INFERENCE RESULT
Large Scale Classification Maps
Crop Cycle Intelligence Timeline
SIGNAL LATENCY: 3 DAYS
Planting
Growth
SatYield Signal
L-3 WEEKS
Official Reports
Harvest
Classification Framework
Intelligence Outputs
INFRASTRUCTURE GATEWAY READY
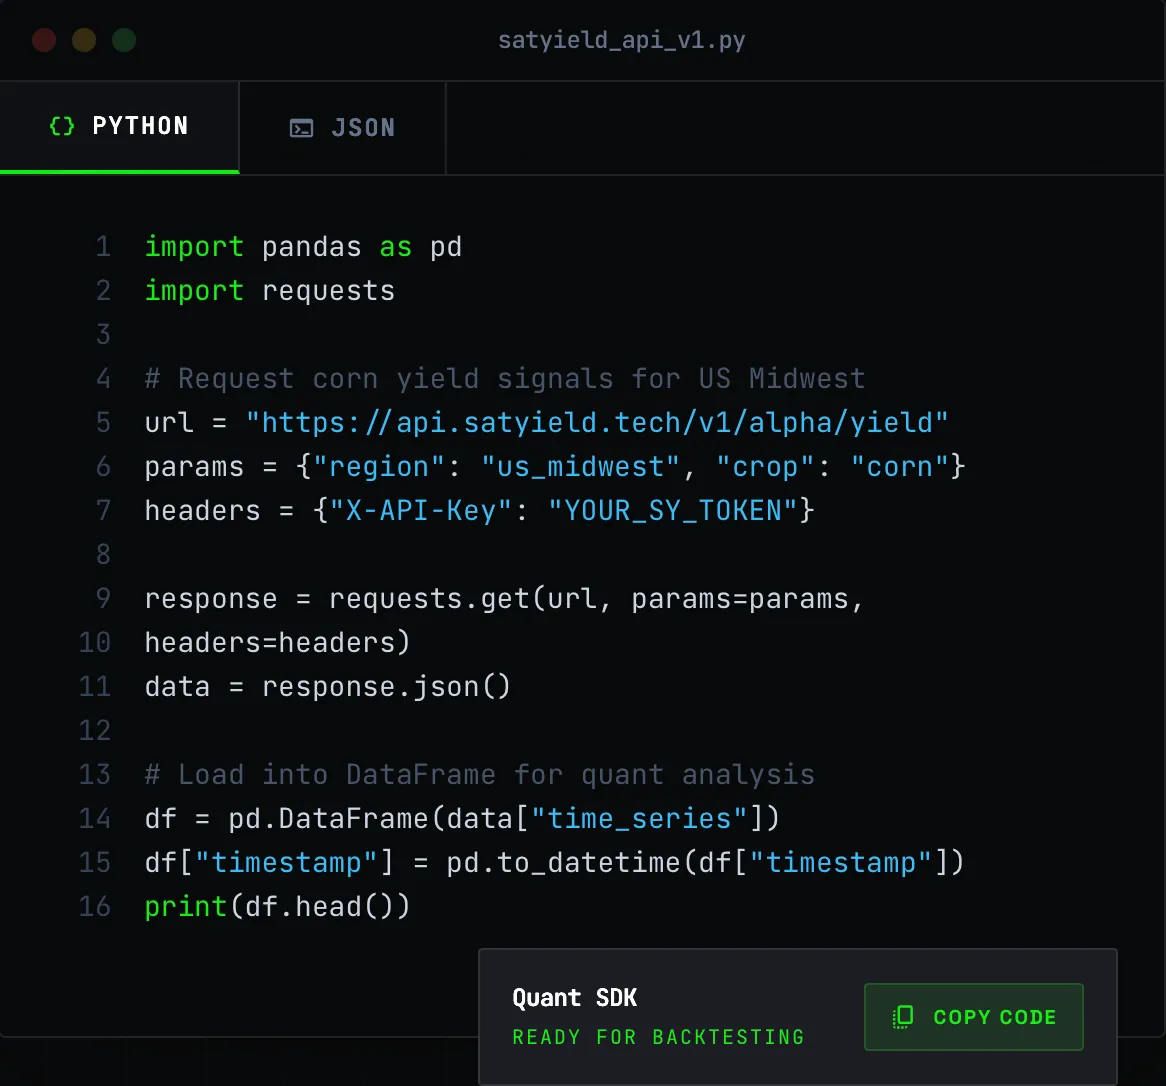
Engineered for Alpha
Seamlessly integrate satellite-derived agricultural signals into your quant stack with our developer-first infrastructure.
REST API
For programmatic access and automation
Batch files (CSV or Parquet)
For research and backtests
Cloud delivery
To supported storage locations
Direct integration support
For client-specific pipelines
DATA INTEGRITY (TRUST ANCHOR)
Point-in-Time and Auditable by Design
SatYield data is built for environments where integrity matters:
Audit Log Stream
Channel: integrity.v2.logs
SY_VERIFIED