

Market Analysis
From Pixel to Decision: How SatYield Called Brazil's 2026 Safrinha Corn Season Weeks Before CONAB
Two months before CONAB's May 14, 2026 report, SatYield's satellite-primary classifier already had Brazil's 2026 Safrinha corn area within 0.51% of the official number - and the live weather and satellite signals were pointing to a yield below CONAB's.
On May 20, 2026, SatYield co-presented a joint webinar with Bloomberg on the state of the 2026 Brazil Safrinha corn season. The session featured two of SatYield's technical leads - Tal Frank, PhD, Director of Algo, and Yoav Sharaby, who leads Agronomic Modeling - walking institutional commodity audiences through the methodology behind in-season crop classification, area estimation, and yield forecasting.
This article is the long-form version of that webinar. It covers how SatYield builds in-season crop maps, why purely statistical models break at exactly the moment markets need them most, and what the live weather, satellite, and yield signals from Mato Grosso and Goiás are revealing about a Safrinha season still in progress. The post is written for commodity traders, hedge fund analysts, ag-focused portfolio managers, and procurement teams whose decisions move ahead of the official reporting cycle.
What did SatYield present at the Bloomberg webinar?
The webinar covered three distinct layers of the SatYield platform:
- The classification engine - how satellite imagery is fused with statistical priors to produce pixel-level, in-season crop maps
- The biophysical digital twin - how weather and satellite signals are ingested into a process-based crop model to generate yield estimates in near real time
- The live Safrinha 2026 numbers - SatYield's national and state-level area, yield, and production estimates benchmarked against CONAB
The thesis tying all three together: commodity markets remain anchored to official reports that arrive weeks or months after the underlying physical reality has shifted. Closing that gap is not a data problem - it is a methodology problem.
Why are commodity markets still flying blind on what is planted?
More than $5 trillion in corn and soy transactions move through commodity markets every year. Most of those positions are still sized against history - the assumption that what happened in the past will happen again - combined with a small set of official reports published at low cadence across the season.
The structural problems are well documented:
- Retrospective by design - official crop masks are typically published four to six months, or sometimes years, after harvest
- Shifting area and climate - planted area is volatile, agricultural frontiers are expanding, and average weather is becoming obsolete in a single season
- Delayed public reports - there is no global in-season classification report that traders can rely on
SatYield was built to close that gap. We have written about the structural limits of legacy reporting in USDA Yield Forecasts Are Systemically Wrong. Satellite Intelligence Isn't. and in The WASDE Is a Newspaper. The Bloomberg webinar focused on the operational layer beneath those critiques: how the classification and yield engine actually works, and what it is currently telling us about Brazil.
How does the SatYield digital twin work?
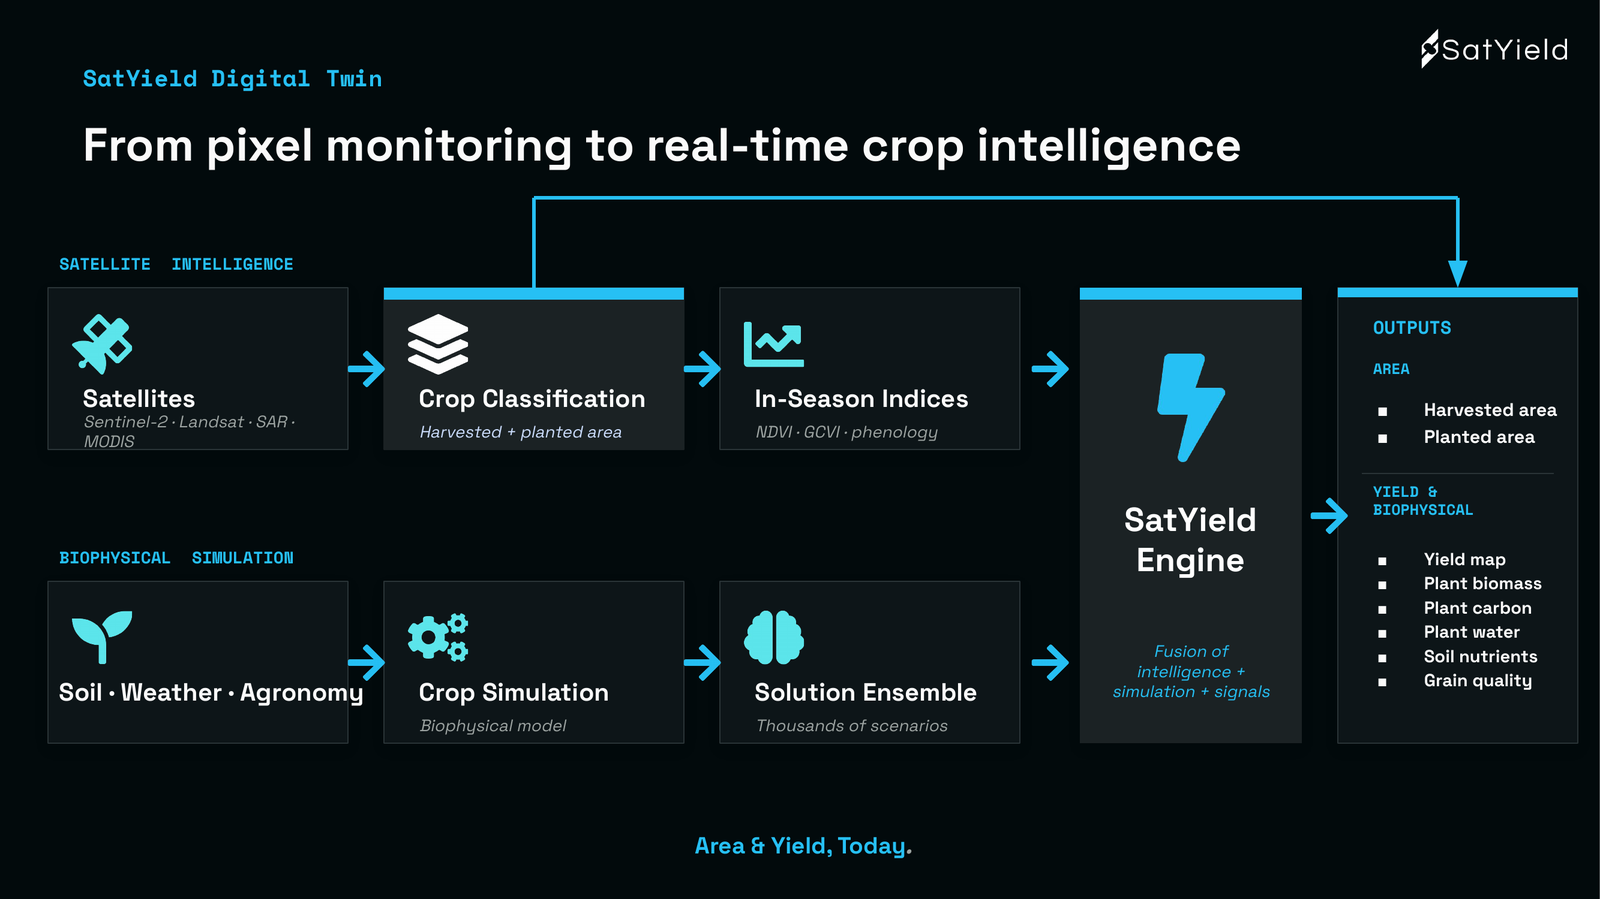
SatYield is an actionable crop intelligence platform that combines scale, speed, and scientific accuracy in near real time. The full stack delivers satellite-driven yield forecasts, near real-time crop monitoring, and a unified feed for health, yield, and area - covered by US Patent US12361501B2. Outputs are delivered two to three months before harvest, with automatic weekly updates, across every major production region.
Under the hood, two parallel flows feed a single engine. The satellite intelligence flow ingests Sentinel-2, Landsat, SAR, and MODIS imagery, runs crop classification to produce harvested and planted area, and computes in-season indices like NDVI, GCVI, and phenology stage. The biophysical simulation flow ingests soil, weather, and agronomy inputs into a process-based crop model, generates thousands of simulated scenarios, and produces a solution ensemble. The SatYield Engine fuses both flows into one unified output: yield maps, planted and harvested area, plant biomass, plant carbon, plant water, soil nutrients, and grain quality - delivered today, not at season end.
For a deeper look at the digital twin layer, see Digital Twins: Real-Time Crop Yield Intelligence.
Why do purely statistical area-prediction models break when traders need them most?
Tal opened the technical portion of the webinar with a case study that compresses the entire methodology into one chart.
Take year-over-year soy area change in Mato Grosso from 2017/18 through 2022/23. The trend is clean - steady, accelerating expansion. Fit a statistical model to that trend and the standard toolkit performs well:
- OLS / Linear Regression - assumes the slope stays stable
- Ridge with L2 Regularization - stable until regime change
- ARIMA - reactive, adapts only after the fact
In a stable system this trio delivers average error under 1%. The model tracks reality. The trade is comfortable.
Then the regime breaks. In 2021/22, the Mato Grosso soy trend snapped. Three forces collided at once: frontier acceleration as area and yields leapt beyond history, a climate pivot that rendered average weather obsolete in a single season, and political shocks that redrew supply rules overnight.

A purely statistical model trained on the prior trend missed Mato Grosso soy area by 0.58 million hectares - approximately 5.06%. As Tal put it during the session: most accurate when least needed. Models trained on the past cannot see the future when the trend breaks. This is the same structural failure described in Why Pure AI Will Struggle in Agricultural Forecasting - statistical pattern matching has no anchor in the underlying physical system, so when the system shifts, the model cannot follow.
How does SatYield's hybrid classifier work?
The SatYield classifier inverts the conventional design. Instead of treating satellite data as an auxiliary input to statistical pillars, satellite imagery is the primary signal. Statistical priors - crop rotation history, weather, supply and demand context - serve as auxiliary features. Both feed a machine learning classifier that is dedicated per crop and per region, and the output is a pixel-level, in-season crop map.
The training pipeline runs in three stages:
- Data collection - historical labeled data and sliced time-series from Sentinel-2, Landsat, and MODIS
- Model training - per-crop, per-region models built on statistical features plus crop-science-tailored features, optimized at both pixel and area level
- In-season inference - live weekly features run through the pre-trained classifiers to produce updated pixel-level maps each week
The design principle: stable when the world is stable, responsive when it isn't. Because classifiers are pre-trained per crop and region, they can be reused across seasons via transfer learning rather than rebuilt from scratch every year.
How much does satellite augmentation reduce area-estimation error?
The cleanest way to see the impact is the four-year back-test on Mato Grosso soy area:
- 2021 - statistical baseline: 2.28% error. Satellite-augmented hybrid: 0.9%
- 2022 (regime break) - statistical baseline: 5.06% error. Satellite-augmented hybrid: 0.7%
- 2023 - statistical baseline: 0.15% error. Satellite-augmented hybrid: 0.5%
- 2024 - statistical baseline: 0.93% error. Satellite-augmented hybrid: 0.8%
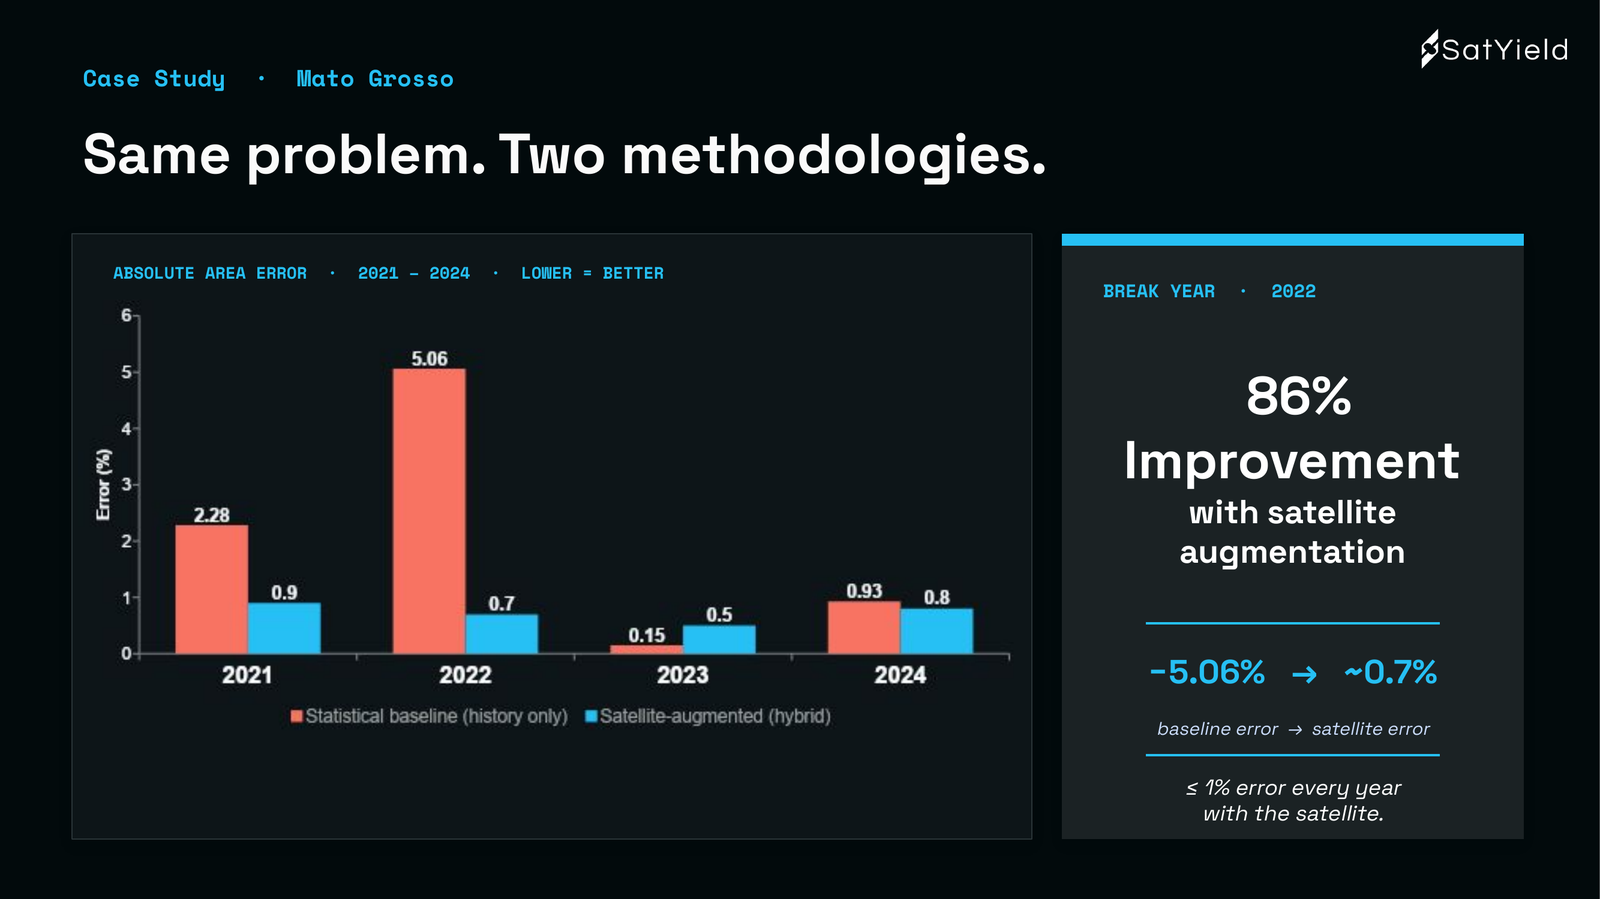
In the 2022 break year, satellite augmentation delivered an 86% error reduction, from 5.06% to roughly 0.7%. Across the full four-year window, the hybrid approach stayed at or under 1% error every year. The statistical baseline only matched the hybrid in stable years - exactly the years where the marginal value of intelligence is lowest. The broader theoretical case for this kind of fusion is covered in Weather Alone Is Not Enough: How Satellites and Crop Models Are Reshaping Yield Forecasting.
How accurate was SatYield's 2026 Safrinha corn area estimate vs. CONAB?
That is the back-test. Here is what the system produced live this season.
SatYield's Safrinha corn 2026 area estimate, first published on March 22, 2026, came in at 14.86 million hectares across the top five states and 17.88 million hectares at the national level. CONAB's reported May 14, 2026 figures were 14.84 million hectares across the same five states and 17.79 million hectares nationally.

The national gap: +0.09 million hectares, or +0.51%. SatYield landed within half a percent of CONAB's number nearly two months before CONAB published it. CONAB's estimate also shifted noticeably over the March-to-May window; SatYield's held flat. For institutional users, the operational point is timing: having the data before everyone else, and having it stable enough to size against.
How does SatYield compare to USDA CDL, MapBiomas, and GLAD?
There are many sources for area and pixel classification. None of them are in-season. USDA CDL, MapBiomas, and GLAD are general-purpose, use one model per country, lack crop or region specialization, and publish four to six months - or years - after harvest. They are valuable history references. They are not operational signals for traders.
SatYield is, today, the only system producing in-season crop maps with the following design choices:
- Dedicated classifier per crop and per region
- Satellite-primary architecture
- Weekly in-season updates
- Global coverage across the U.S., Brazil, Argentina, Canada, and Australia
- Operational, not retrospective
- Independent of any official agency
Official agencies provide the history reference. SatYield built the in-season product. For the full argument on why the world needs an independent classification layer, see Beyond USDA CDL: Why the World Needs an Independent Global Crop Classification Layer.
What is the Brazil Safrinha corn season and why does it matter?
Yoav then took the audience a step beyond the area number and into what the live weather and satellite signals are revealing about the 2026 Safrinha season.
The context first. Brazil is the second-largest corn exporter globally and accounts for roughly 10% of global corn production. Corn is primarily cultivated in Brazil as a secondary crop - the Safrinha - planted at the end of summer in February and March, immediately after soybean harvest, with harvest completing in mid-winter in August. The 2025 Safrinha was the highest corn-producing season ever recorded.
The structural shift over the last 20 years is dramatic. Total Brazilian corn area has steadily climbed to 22.2 million hectares last season, but the composition has flipped: Safrinha now represents 17.8 million hectares, or roughly 80% of the total, with the main-season Safra continuing to shrink. Safrinha yield has tracked higher as well, reaching a peak of 6,364 kg/ha in 2025.
SatYield monitors the top five Safrinha-producing states - Mato Grosso, Mato Grosso do Sul, Goiás, São Paulo, and Paraná. Collectively these states represent approximately 83% of total Brazilian Safrinha corn area and 89% of total production. State-level estimates are aggregated into a national figure each week.

What do live weather and satellite signals show in Mato Grosso?
Mato Grosso is the dominant corn hub, responsible for almost half of Safrinha corn production. The 2026 corn mask covers 7.5 million hectares - and the area trend in Mato Grosso has expanded far faster than in any of the other four monitored states over the last 20 years.
[INSERT IMAGE 6 HERE: mato-grosso-safrinha-corn-area-trend-2026-crop-mask.png | alt text: Mato Grosso Safrinha corn area expansion from 1990 to 2026 reaching 7.5 million hectares alongside 2026 corn mask map showing pixel-level crop classification | caption: Figure 6. Mato Grosso is the biggest corn hub in Brazil. The state's Safrinha corn area has expanded dramatically over 20 years, with the 2026 mask covering 7.5 million hectares.]
Pulling weather data from the 2026 crop mask gives a clean picture of what the crop has actually experienced:
- Rainfall - cumulative rainfall through May 16 has been evenly distributed since January 1 and slightly above the 15-year average. A positive sign for productivity
- Temperature - 2026 has run slightly warmer than the 15-year mean. Because temperatures in Mato Grosso rarely exceed 28°C and pose no significant heat risk, the warmer signal is beneficial for growth, not damaging

The satellite confirms it. The 2026 weighted-average Leaf Area Index (LAI) - the canopy-size proxy that tracks vegetative vigor - peaked at 3.25 in Mato Grosso, a high reading compared to the previous three seasons and close to the 2025 peak that delivered a record yield. Higher LAI means a larger canopy, enhanced vegetative growth, and generally higher yield potential.

The composite signal in Mato Grosso: good rainfall distribution supporting productivity, warm temperatures enhancing biomass accumulation, and satellite-verified boosted vegetative vigor. All three point to a relatively higher yield in 2026.
Why is SatYield diverging from CONAB on Goiás yield?
Goiás tells the opposite story. With an estimated 1.9 million hectares in 2026, Goiás is the fourth-largest Safrinha state - and the cleanest example of where SatYield currently diverges from CONAB on yield.
The cumulative rainfall distribution looks reasonable at first glance, tracking inside the 15-year band through April. But rain effectively stopped at the start of April, right at the transition into the reproductive stage - meaning the crop entered grain fill with a developing water shortage. The temperature anomaly chart adds a second negative: most of the 2026 season in Goiás has run cooler than average, which slows crop growth and reduces biomass accumulation efficiency.

The satellite reflects it directly. The Goiás 2026 LAI peaked at just 3.13, against a three-year average of nearly 3.5. The same signal stack that flagged Mato Grosso as strong is flagging Goiás as restrained: rainfall shortage during grain fill suppressing yield potential, cool temperatures depressing growth, and reduced vegetative vigor confirmed from space.

Mixed signals here point to a relatively lower yield - and this is exactly the kind of in-season environmental read that statistical models built on multi-year averages cannot capture. The broader argument is covered in Is It Going to Rain or Not? Why That Question Misses the Point in Ag Markets.
What is SatYield's national yield estimate for Brazil's 2026 Safrinha corn?
Aggregating state-level estimates produces the national Safrinha corn picture as of May 16, 2026:
- SatYield - 17.9 million hectares predicted area, 5,972 kg/ha predicted yield, 106.8 million metric tons predicted production
- CONAB - 17.8 million hectares reported area, 6,096 kg/ha reported yield, 108.5 million metric tons reported production
- Delta - +0.54% on area, -2.03% on yield, -1.51% on production

SatYield has been publishing national estimates since March 22 - early in the season - and the yield curve has stayed consistently below CONAB's from the first issue forward. The latest area estimate of 17.9 million hectares ran slightly above CONAB's May 14 figure of 17.79 million; the yield estimate of 5,972 kg/ha sat below CONAB's 6,096 kg/ha, directly reflecting the environmental signals the engine is currently ingesting.
Where does SatYield agree and disagree with CONAB at the state level?
Disaggregating to the state level shows where SatYield aligns and diverges with CONAB on May 16, 2026:
- Mato Grosso - CONAB 7,154 kg/ha, SatYield 7,177 kg/ha, +0.32% difference. Both sources expect a high yield
- Paraná - CONAB 5,978 kg/ha, SatYield 5,922 kg/ha, -0.80% difference. Effectively aligned
- São Paulo - CONAB 5,272 kg/ha, SatYield 5,415 kg/ha, +2.71% difference
- Mato Grosso do Sul - CONAB 5,838 kg/ha, SatYield 5,287 kg/ha, -9.44% difference. Lower than CONAB, but still above the last three-year average
- Goiás - CONAB 5,903 kg/ha, SatYield 5,498 kg/ha, -6.86% difference. The most consequential divergence: in Goiás, SatYield's lower yield estimate also falls below the three-year average, which CONAB does not currently reflect

What do the 2026 signals mean for commodity traders?
Pulled together, the picture is clear. The 2026 Safrinha corn season is going to yield high - but not as high as the record-setting 2025 season. Weather and satellite signals explain the trend with state-level resolution: stronger in Mato Grosso and Paraná, weaker in Goiás and Mato Grosso do Sul. Because SatYield ingests environmental signals in real time through the digital twin, the national yield call landed below CONAB's right from the start of the season and has held that position week after week as the underlying signals reinforced it.
The operational implication for institutional users is timing. CONAB's May 14 report represented the official benchmark. SatYield's national area estimate published on March 22 - 53 days earlier - landed within 0.51% of that benchmark. The yield call, anchored in observed weather and satellite vigor rather than survey-based reporting, points to a measurable downside relative to the official number. For more on why timing is the actual edge in this domain - rather than the magnitude of any single estimate - see In Agriculture, Alpha Is Not Information. It Is Time.
Key takeaways
- Statistics alone go blind when the trend breaks - and trends are breaking more often, in more places, faster than they used to
- Satellite-driven hybrid classifiers win - dedicated per crop and per region, with satellite as the primary signal, they delivered sub-1% area error every year of the 2021-2024 back-test, including the regime-break year
- SatYield is an independent alternative to official reporting, not a derivative of it - which is the entire point of having a second signal
- The product is in-season and global - U.S., Brazil, Argentina, Canada, Australia - built for markets, not retrospect
- Brazil 2026 Safrinha is high but not record-high - SatYield's national yield estimate of 5,972 kg/ha sits 2.03% below CONAB's 6,096 kg/ha, and the satellite signal explains the regional divergence weeks before the official numbers will
See SatYield's in-season Safrinha 2026 signals for yourself
If you want to explore SatYield's live area, yield, and production estimates - or see how Tradable Supply Intelligence integrates with your existing trading or research workflow - the fastest way in is the SatYield AI Agent. Ask it for current numbers, request a walkthrough of the methodology, book a demo, or start a trial. It is the same engine described in this post, made conversational.
In cased you missed our latest webinar Brazil Corn Season Debrief: you can Watch the webinar replay here
more from the blog