
Market Analysis
Physical AI in Agriculture: How Crop Digital Twins Bring the Field Into Farm Finance
Physical AI is usually described with robots. In agriculture, the most valuable physical system to model is the crop itself, and the institutions that finance it need that model most.
Key takeaways
Physical AI is AI that models how the real world behaves, not just how data has looked. Robots and autonomous vehicles made the term popular. In agriculture, the physical system that matters most to finance is the crop.
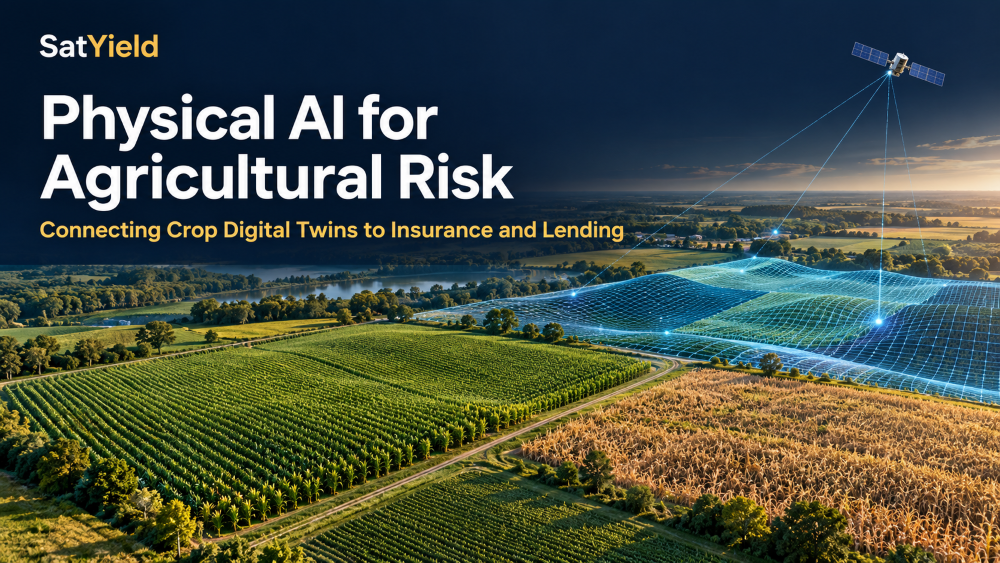
A crop digital twin is physical AI for agriculture. SatYield runs third-party satellite observations, weather and soil data through a biophysical simulation of the plant, updated continuously across entire growing regions.
Farm economics start with yield. Revenue, repayment capacity and insured losses all trace back to how much a crop actually produces. A model of the physical crop is a model of the first line of the farm income statement.
Same weather, different losses. A regional drought index describes a shared hazard. A digital twin estimates how that hazard plays out against each soil, crop and growth stage, which is where credit and loss risk actually diverge.
The record is public. On September 7, 2026, our model read U.S. corn at 178.56 bu/ac, four days before USDA printed 178.5. The methodology behind it is patent-protected and peer-reviewed.
What is physical AI, and why does agriculture need its own definition?
Physical AI has become one of the most used phrases in technology this year. Most of the conversation is about machines: robots, autonomous vehicles, factory automation. The common thread is AI that has to understand how the physical world behaves, not just predict the next word or the next price.
Agriculture has its own version, and it does not require a single robot.
The physical system is the crop. A living organism responding every day to sunlight, temperature, soil moisture and stress, on a biological schedule that does not care about historical averages.
Most AI applied to agriculture so far has been pattern recognition. Models learn how yields correlated with weather or vegetation indices in past seasons and project that forward. That works in normal years. It breaks in the years that matter most, which is the argument we made in Why Pure AI Will Struggle in Agricultural Forecasting.
Physical AI in agriculture means something different. It means a model of the crop itself, constrained by what is actually being observed in the field, and able to answer what happens next under conditions the past never recorded.
What makes a crop digital twin physical AI rather than another data product?
A crop digital twin is a running simulation of a real crop in a real place.
At SatYield, we build it from four inputs: third-party satellite observations of the canopy, observed and forecast weather, soil information, and a biophysical crop model that simulates growth, water use and grain formation through the season.
The satellite layer keeps the simulation honest. Leaf Area Index readings at 10 meters per pixel show how the canopy is actually developing, and the simulation is continuously corrected toward that observed reality. We have described this as the shift from pixels to physiology.
Three properties separate this from a dashboard of vegetation indices.
It models causes, not just symptoms. A satellite image can show that a canopy is stressed. The digital twin estimates what that stress means for kernel number or seed weight, given where the crop is in its development.
It can run forward. Because the model simulates the plant rather than recalling history, it can test scenarios the historical record never contained: a dry July after a wet June, a heat wave during pollination, a record El Niño.
It works across scales. The same engine produces estimates from field to county, state and national level, so the number a portfolio sees and the number a commodity desk sees come from the same physics.
The core methodology is patent-protected and was first validated in peer-reviewed research published in Agronomy for Sustainable Development (2024). In our view, that combination of a physical model, continuous observation and published validation is what separates physical AI from a black box with a satellite feed.
Why does farm finance need a model of the physical crop?
Every agricultural loan and every crop insurance policy rests on the same uncertain quantity: how much the crop will actually produce.
The farm income statement starts there. Revenue is yield times price. Price is visible every second on an exchange screen. Yield is invisible until harvest, and it is the variable lenders and insurers have the least timely information about.
A simple illustration shows the stakes. Take a 1,500-acre corn operation expecting 180 bu/ac at $4.80 per bushel, the season-average price USDA used in September. Expected crop revenue is about $1.30 million.
A 15% yield shortfall, the kind a badly timed dry spell can produce locally even in a normal national year, removes roughly $194,000 of that revenue.
For a borrower on tight margins, that is the difference between a routine renewal and a restructuring conversation. For an insurer, it is the difference between a quiet county and a cluster of claims.
Today, most institutions learn the size of that gap at harvest, or when the borrower calls. A physical model of the crop can surface it during the season, while there are still options.
Why can the same weather produce very different losses?
Consider two corn farms in the same county during a prolonged dry spell.
One sits on deeper soil with more water-holding capacity. The other has lighter soil, and its crop reaches pollination just as the heat peaks.
Both sit inside the same drought footprint. A regional weather index treats them identically. Their yields could finish tens of bushels apart.
This is exactly the distinction a crop digital twin is built to make. Corn sets kernel number in a narrow window around pollination, and once that window closes the loss is locked in. A model that runs the plant forward can register that the same dry week hit one field during pollination and another during early grain fill. We saw this play out across the 2026 Corn Belt, where alternating wet and dry cycles split outcomes by geography and timing.
For a lender or insurer, the hazard is shared. The loss is not. Physical AI is how you tell them apart before the combine does.
What does this mean for crop insurers and underwriters?
For insurers, a crop digital twin turns the growing season from a waiting period into a monitoring period.
Earlier loss signals. Production estimates that update weekly can show where losses are likely emerging across a township, county or book of business, before claims arrive.
Better adjuster deployment. When a weather event hits, knowing which areas are likely hardest hit helps prioritize field assessments.
Portfolio concentration. Simulated outcomes can reveal where exposure is correlated, for example a book weighted toward soils or regions that respond the same way to heat at a sensitive stage.
Scenario stress testing. Running forecast weather ensembles through the model turns a seasonal outlook into a range of outcomes. When we ran 10 representative ECMWF scenarios through our Brazil soybean digital twins this season, Bahia landed 38% below trend in the expected case while Mato Grosso came in above trend. A single national El Niño headline would have missed that split entirely.
Production estimates still need to be read against policy terms, guarantees, deductibles and prices before they say anything about claims. The value is a clearer view of the physical loss underneath them.
What does this mean for agricultural lenders?
For agricultural banks, the crop is collateral that grows. Physical AI gives credit teams a way to watch it grow.
Earlier borrower conversations. A deteriorating production outlook in a borrower's area is a reason to call in July, not in January.
Regional stress testing. Lenders can examine how continued adverse weather would affect expected revenue across geographic concentrations in their portfolio, using scenarios grounded in crop biology rather than generic drought assumptions.
Independent evidence. In-season production estimates add a third-party view alongside borrower-reported expectations and historical yields.
Yield is not the whole credit picture. Repayment capacity also depends on prices, operating costs, leverage, insurance protection and off-farm income. But yield is the piece that has been hardest to see in real time, and it is the piece physical AI addresses directly. We have also explored how the same digital twin signals can support ESG-linked agricultural financing.
How do we know a crop digital twin works?
Any model sold to a risk function should be judged in public, on dated numbers, including the misses.
On September 7, 2026, our digital twin estimated U.S. corn yield at 178.56 bu/ac. USDA's September 11 report printed 178.5. In October, our soybean estimate landed within about 1.1% of the official figures on yield, area and production.
October was humbler on corn. USDA raised its yield to 181.2 while our model held near 178, and we published that gap along with our reasoning. In our view, a model that shows its record, good months and bad, is the only kind a credit or underwriting committee should trust.
Validation also has to happen at the scale where decisions are made. A model validated at county or state level does not automatically deliver reliable farm-level estimates. Each insurance and lending application should be tested against reference data at the level it will be used, and we build our partnerships around that step.
Where is physical AI in agriculture heading?
The first wave of agricultural AI asked what happened. The next wave asks what will happen, and why.
For financial institutions, that shift matters more than any single forecast. It moves crop risk from something measured after the fact to something monitored as it develops, with the physical reasons visible.
Robots may eventually transform how crops are planted and harvested. The more immediate opportunity for farm finance is simpler: a living, continuously corrected model of the crop that sits underneath the loan and the policy.
SatYield is building that model, crop by crop and region by region, across the U.S., Brazil and Argentina.
If you are an agricultural lender, crop insurer or underwriter, we would welcome a conversation about where a crop digital twin fits your risk process.
Frequently asked questions
What is physical AI in agriculture?
Physical AI in agriculture is AI that models how crops physically grow and respond to their environment, rather than only learning statistical patterns from past data. It combines real-world observations, such as satellite imagery and weather, with simulations of crop biology to estimate current conditions and future outcomes.
Is physical AI in agriculture the same as agricultural robotics?
No. Robotics applies physical AI to machines that act in the field. Crop digital twins apply it to the crop itself, modeling growth, stress and yield. For financial institutions, the crop model is usually the more relevant application, because yield drives farm revenue and insured losses.
What is a crop digital twin?
A crop digital twin is a continuously updated simulation of a real crop in a specific location. SatYield builds digital twins by running third-party satellite observations, weather and soil data through a biophysical crop model, producing estimates of crop condition, yield and production from field to national scale.
How can crop insurers use crop digital twins?
Insurers can use in-season production estimates to identify where losses may be emerging, prioritize field assessments, examine portfolio concentration and stress test books of business against weather scenarios. Estimates still need to be interpreted alongside policy terms, guarantees and prices.
How can agricultural lenders use crop digital twins?
Lenders can use changing production outlooks to flag borrowers or regions for earlier review, stress test geographic concentrations and add independent evidence to credit assessments. Yield is one input to repayment capacity, alongside prices, costs, leverage and insurance coverage.
Does SatYield operate its own satellites?
No. SatYield uses third-party satellite observations and combines them with weather, soil data and its patent-protected crop simulation engine.
See how SatYield tracks crop production week by week, state by state. Explore the SatYield AI Agent.
A closing note in my own voice. I came to agriculture from software and finance, not from the field, and I am still learning how insurers and lenders actually make these decisions. Physical AI is a big phrase, and I have tried not to stretch it. If you work in crop insurance or ag lending and see where this fits, or where it does not, I would like to hear it.
more from the blog
