
Market Analysis
How SatYield is quantifying Brazil's 2026/27 soybean season
By Omer Perach, Ph.D, Agronomic Modeling Researcher at SatYield
Published on Medium on August 24, 2026. Read the original article on Medium
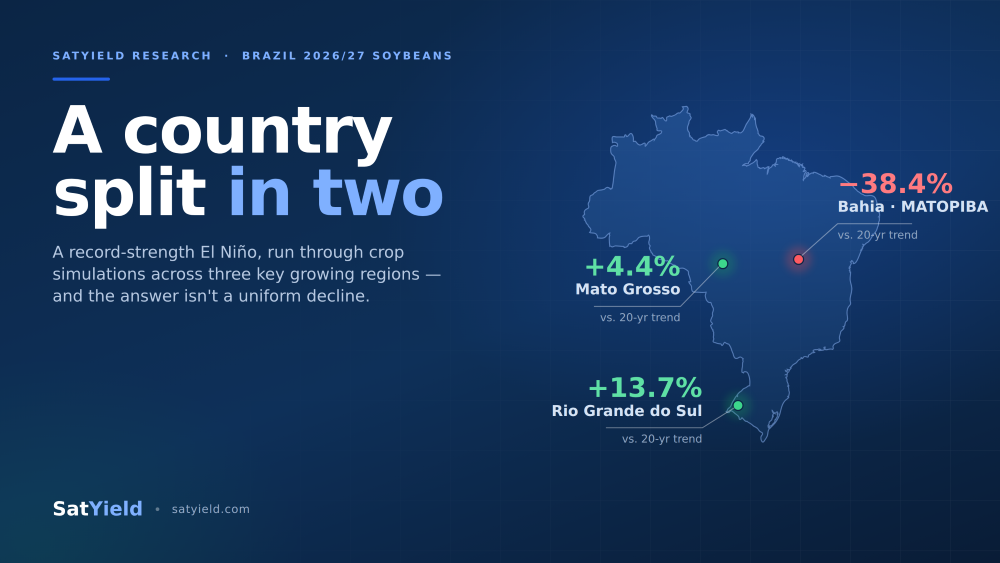
A record-strength El Niño is bearing down on Brazil's 2026/27 soybean season, and global markets are already bracing for the worst: the World Meteorological Organization has flagged it as potentially the strongest ever recorded. But "El Niño will hurt Brazilian soy" is a headline, not a forecast. At SatYield, we ran the actual weather scenarios through crop simulations across three of Brazil's key growing regions to find out what's really likely to happen, and the answer isn't a uniform decline. It's a country split in two.
The answer isn't a uniform decline. It's a country split in two.
Satellite-observed crop behavior + physically-based simulation + ECMWF weather scenarios
01 | Climate Signal: The El Niño Pattern and Regional Divergence
El Niño is a recurring climate pattern: a warming of surface waters in the eastern tropical Pacific that disrupts rainfall patterns worldwide, tracked via the Oceanic Niño Index (ONI) and classified strong past +1.5°C, very strong past +2.0°C. It typically peaks December-February, squarely inside Brazil's growing season. The last comparable events were 2009/10 (moderate, +1.6°C) and 2015/16 (+2.8°C, one of the strongest on record), and 2026/27 is forecast to land in that same range, potentially higher. But strength alone doesn't say how Brazil gets hit: the warming shifts the jet stream, producing opposite rainfall anomalies at different latitudes, drought pushing into the north, wetter conditions further south. That's exactly why the impact on Brazil's soy crop was never going to be uniform.
Strength alone doesn't say how Brazil gets hit.
02 | Modeling Approach: Digital Twins and Weather Scenarios
We built digital twins of the crop, fusing satellite observation of millions of soybean hectares with physically-based crop simulations, so a weather scenario becomes an actual yield number ahead of harvest. We pulled the latest forecast from ECMWF, the standard in agricultural and commodities forecasting: 50 possible six-month weather trajectories, from hottest-and-driest to wettest-and-coldest, screened down to 10 representative scenarios. Each ran through crop models calibrated for three states: Mato Grosso (center-west), Bahia (the MATOPIBA frontier, north), and Rio Grande do Sul (south), anchored to satellite-observed crop behavior from past seasons whose weather most closely matched each simulated scenario, across each state's top-producing municipalities.
50 six-month weather trajectories | 10 representative scenarios | 3 states modeled
03 | State-Level Outcomes: Regional Yield Forecasts
El Niño hits Brazil unevenly
2026/27 soybean yield forecast vs. the 20-year (2005/06-2024/25) yield trend, by state
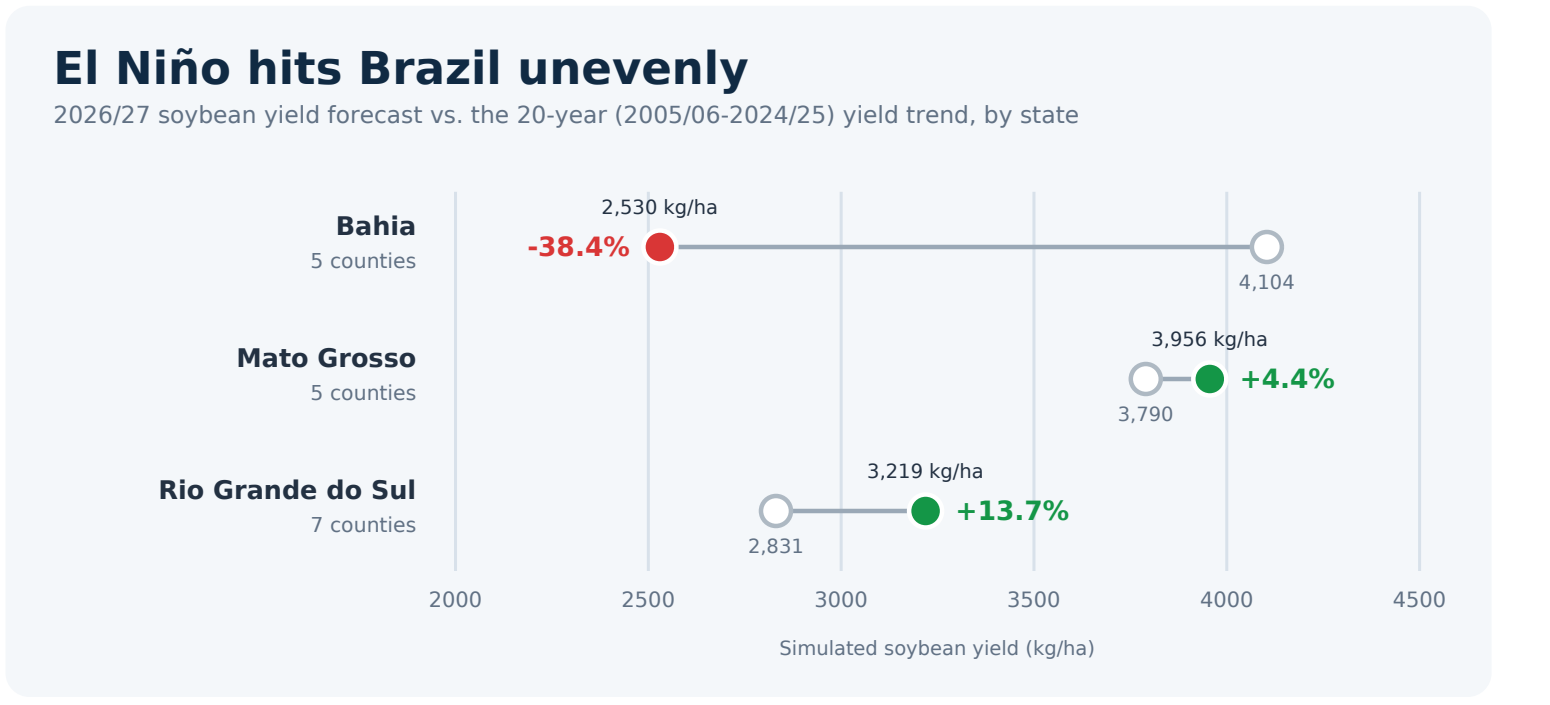
Bahia (5 counties): 2,530 kg/ha, -38.4% (trend 4,104)
Mato Grosso (5 counties): 3,956 kg/ha, +4.4% (trend 3,790)
Rio Grande do Sul (7 counties): 3,219 kg/ha, +13.7% (trend 2,831)
Source: SatYield APSIM + SEAS5 simulation, Aug 2026 | satyield.com
Bahia, standing in for the MATOPIBA frontier, is the real concern: -38.4% below its 20-year yield trend, with no good scenario in the mix. Across all 10 weather trajectories simulated, even the best case still lands 18% below trend, and Bahia saw an even deeper collapse (-48.8% below trend) in 2015/16, the last comparably strong El Niño. Mato Grosso, by contrast, comes through essentially unshaken (+4.4% above its 20-year trend), and Rio Grande do Sul sees a real lift (+13.7% above trend).
Bahia is the real concern: -38.4% below its 20-year yield trend, with no good scenario in the mix.
04 | National Sensitivity: Production Sensitivity and the MATOPIBA Factor
Yield differences only matter to markets once translated into production: yield times area planted. We applied each region's simulated yield to its actual 2025/26 planted footprint, held fixed, then added in the rest of Brazil's soy states at their current output. We deliberately used today's area rather than a historical average, because MATOPIBA's share of national soybean production has nearly tripled over the past 20 years, from 5% to 13%, as its farmland has expanded and its yields have caught up to the national average. Averaging that away would understate exactly the exposure this story is about.
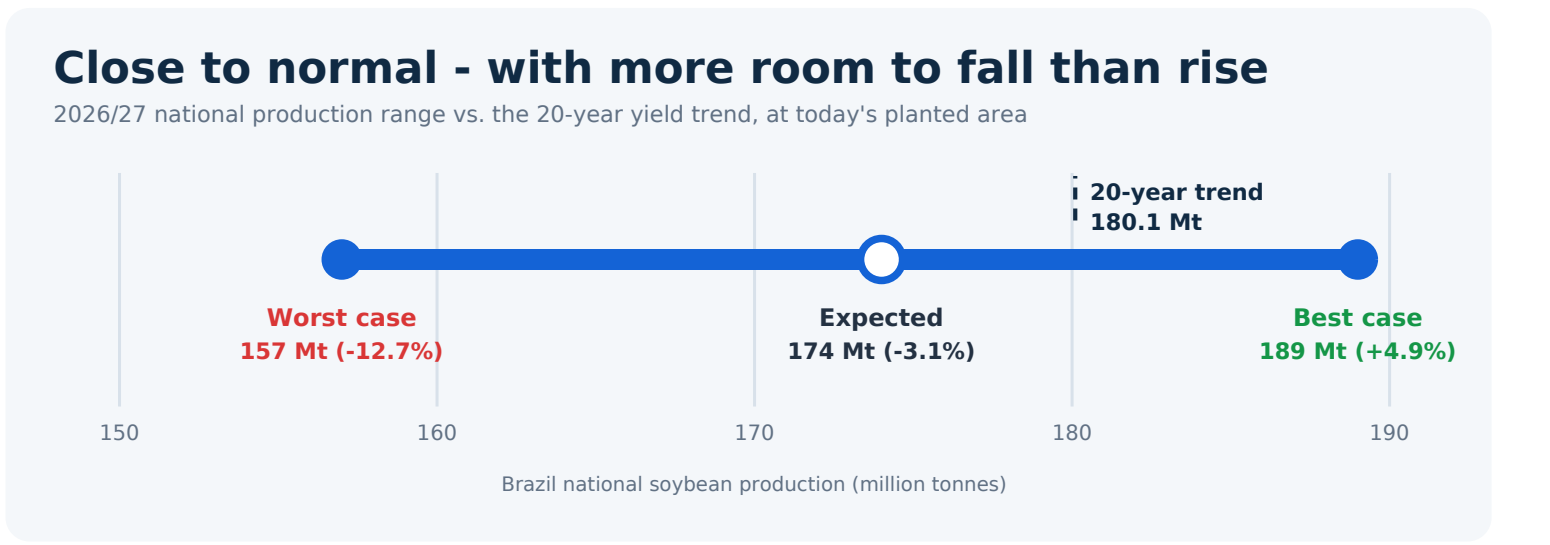
Close to normal - with more room to fall than rise
2026/27 national production range vs. the 20-year yield trend, at today's planted area
20-year trend: 180.1 Mt
Worst case: 157 Mt (-12.7%)
Expected: 174 Mt (-3.1%)
Best case: 189 Mt (+4.9%)
MT + Bahia (as MATOPIBA proxy) + RS simulated; other states held at 2025/26 levels. Source: SatYield APSIM + SEAS5 simulation, Aug 2026 | satyield.com
That's the real headline hiding inside the national number: Brazil's aggregate soy outlook is now more sensitive to MATOPIBA than it has ever been, not because it's the biggest region, but because it's the fastest-growing one. A decade ago, a MATOPIBA drought this severe would barely have moved Brazil's total production. Today, it's the single biggest swing factor behind the entire national range, the reason the downside outweighs the upside in Graph 2, and the region worth watching most closely as this El Niño plays out.
Close to normal - with more room to fall than rise.
Conclusion: A country split in two
This is a first look, not a final forecast, built to show how El Niño is likely to redistribute Brazil's soy production this season, not to pin down one number. The headline fear was uniform decline; the reality is a country split in two, with one region absorbing nearly all of the damage. As the season develops, ECMWF's forecast reinitializes monthly, and satellite data will keep confirming or correcting these signals on the ground, so that picture will keep sharpening. If you're exposed to this crop and want the fuller regional breakdown, updated through the season, reach out to us at satyield.com.
The headline fear was uniform decline; the reality is a country split in two, with one region absorbing nearly all of the damage.
Satellite-driven crop intelligence. SatYield for markets, risk and supply decisions. satyield.com
more from the blog